

210
8: Stefan A. Robila, Pramod K. Varshney
8.5
Experimental Results
To assess the effectiveness of the proposed algorithms we have conducted
several experiments using AVlRlS data (Sect. 4.4.3 of Chap. 4 for details on this
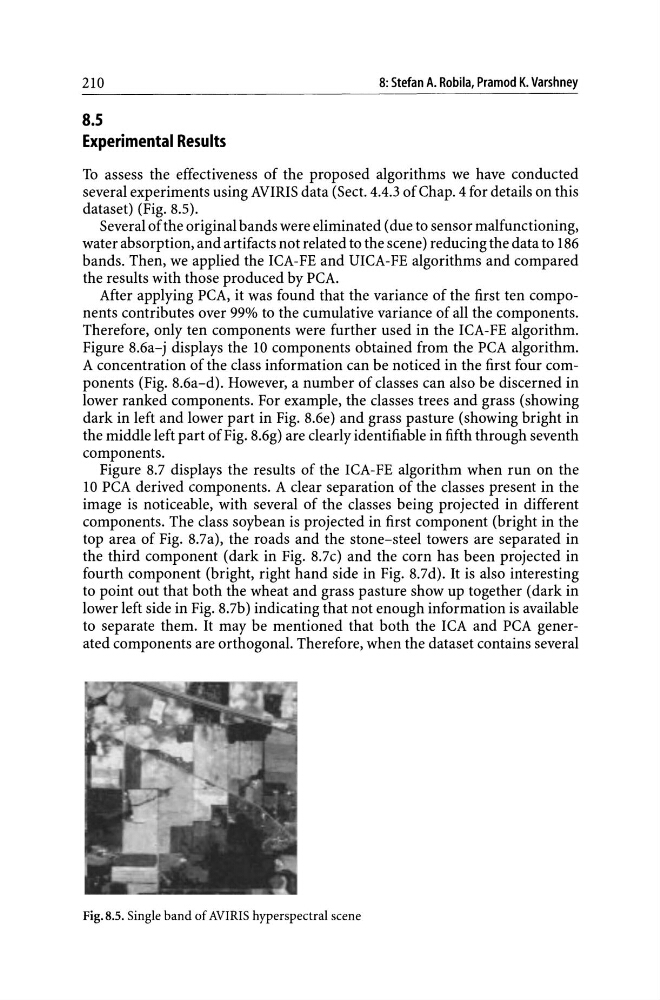
dataset) (Fig. 8.5).
Several of the original bands were eliminated (due to sensor malfunctioning,
water absorption, and artifacts not related to the scene) reducing the data to 186
bands. Then, we applied the lCA-FE and urCA-FE algorithms and compared
the results with those produced by PCA.
After applying PCA, it was found that the variance of the first ten components contributes over 99% to the cumulative variance of all the components.
Therefore, only ten components were further used in the lCA-FE algorithm.
Figure 8.6a-j displays the 10 components obtained from the PCA algorithm.
A concentration of the class information can be noticed in the first four components (Fig. 8.6a-d). However, a number of classes can also be discerned in
lower ranked components. For example, the classes trees and grass (showing
dark in left and lower part in Fig. 8.6e) and grass pasture (showing bright in
the middle left part of Fig. 8.6g) are clearly identifiable in fifth through seventh
components.
Figure 8.7 displays the results of the ICA-FE algorithm when run on the
10 PCA derived components. A clear separation of the classes present in the
image is noticeable, with several of the classes being projected in different
components. The class soybean is projected in first component (bright in the
top area of Fig. 8.7a), the roads and the stone-steel towers are separated in
the third component (dark in Fig. 8.7c) and the corn has been projected in
fourth component (bright, right hand side in Fig. 8.7d). It is also interesting
to point out that both the wheat and grass pasture show up together (dark in
lower left side in Fig. 8.7b) indicating that not enough information is available
to separate them. It may be mentioned that both the lCA and PCA generated components are orthogonal. Therefore, when the dataset contains several
Fig.8.s. Single band of AVIRIS hyperspectral scene
8: Stefan A. Robila, Pramod K. Varshney
8.5
Experimental Results
To assess the effectiveness of the proposed algorithms we have conducted
several experiments using AVlRlS data (Sect. 4.4.3 of Chap. 4 for details on this
dataset) (Fig. 8.5).
Several of the original bands were eliminated (due to sensor malfunctioning,
water absorption, and artifacts not related to the scene) reducing the data to 186
bands. Then, we applied the lCA-FE and urCA-FE algorithms and compared
the results with those produced by PCA.
After applying PCA, it was found that the variance of the first ten components contributes over 99% to the cumulative variance of all the components.
Therefore, only ten components were further used in the lCA-FE algorithm.
Figure 8.6a-j displays the 10 components obtained from the PCA algorithm.
A concentration of the class information can be noticed in the first four components (Fig. 8.6a-d). However, a number of classes can also be discerned in
lower ranked components. For example, the classes trees and grass (showing
dark in left and lower part in Fig. 8.6e) and grass pasture (showing bright in
the middle left part of Fig. 8.6g) are clearly identifiable in fifth through seventh
components.
Figure 8.7 displays the results of the ICA-FE algorithm when run on the
10 PCA derived components. A clear separation of the classes present in the
image is noticeable, with several of the classes being projected in different
components. The class soybean is projected in first component (bright in the
top area of Fig. 8.7a), the roads and the stone-steel towers are separated in
the third component (dark in Fig. 8.7c) and the corn has been projected in
fourth component (bright, right hand side in Fig. 8.7d). It is also interesting
to point out that both the wheat and grass pasture show up together (dark in
lower left side in Fig. 8.7b) indicating that not enough information is available
to separate them. It may be mentioned that both the lCA and PCA generated components are orthogonal. Therefore, when the dataset contains several
Fig.8.s. Single band of AVIRIS hyperspectral scene