

124
4: Stefan A. Robila
components of interest. Unfortunately, hyperspectral data are sometimes affected by impulse noise (Chang et al. 2002) that results in components with
very high kurtosis. With respect to this, an algorithm using minimization of
mutual information may prove to be more robust than the ones based on
non-Gaussianity (Hyvarinen et al. 2001).
The success of the application of I CA to hyperspectral imagery relies on how
well a hyperspectral image cube can be modeled to fit the ICA requirements.
We discuss two different models, one is based on feature extraction to reduce
the dimensionality of the dataset and is inspired by PCA. The other is based
on the concept oflinear mixture model frequently used to determine the class
proportions of mixed pixels or perform fuzzy classification (see Sect. 2.6.4 in
Chap. 2) in the image.
4.4.1
Feature Extraction Based Model
Let us construct a vector space of size equal to the number of spectral bands.
A pixel vector in the hyperspectral image is a point in such a space, with each
coordinate given by the corresponding intensity value (Richards and Jia 1999).
The visualization of the image cube plotted in the vector space provides useful
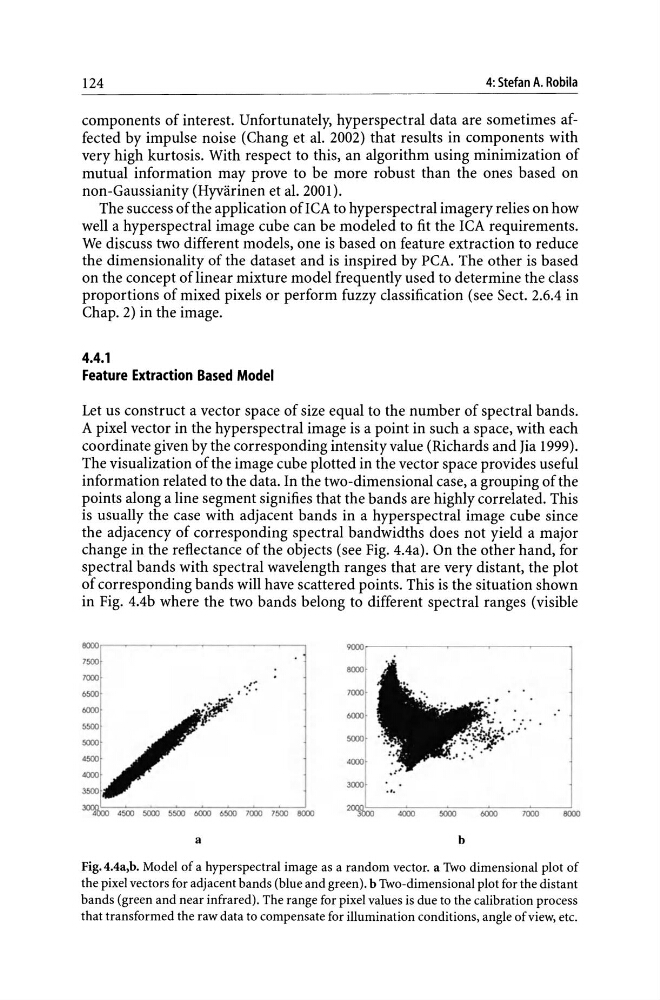
information related to the data. In the two-dimensional case, a grouping of the
points along a line segment signifies that the bands are highly correlated. This
is usually the case with adjacent bands in a hyperspectral image cube since
the adjacency of corresponding spectral bandwidths does not yield a major
change in the reflectance of the objects (see Fig. 4.4a). On the other hand, for
spectral bands with spectral wavelength ranges that are very distant, the plot
of corresponding bands will have scattered points. This is the situation shown
in Fig. 4.4b where the two bands belong to different spectral ranges (visible
7500
7000
6500
4500 5000 5500 IlOOO 6500 7000 7500 8000
a
9000
8000
7000
IlOOO
5000
4000
3000
~
...
4000
5000
IlOOO
7000
8000
b
Fig.4.4a,b. Model of a hyperspectral image as a random vector. a Two dimensional plot of
the pixel vectors for adjacent bands (blue and green). b Two-dimensional plot for the distant
bands (green and near infrared). The range for pixel values is due to the calibration process
that transformed the raw data to compensate for illumination conditions, angle of view, etc.
4: Stefan A. Robila
components of interest. Unfortunately, hyperspectral data are sometimes affected by impulse noise (Chang et al. 2002) that results in components with
very high kurtosis. With respect to this, an algorithm using minimization of
mutual information may prove to be more robust than the ones based on
non-Gaussianity (Hyvarinen et al. 2001).
The success of the application of I CA to hyperspectral imagery relies on how
well a hyperspectral image cube can be modeled to fit the ICA requirements.
We discuss two different models, one is based on feature extraction to reduce
the dimensionality of the dataset and is inspired by PCA. The other is based
on the concept oflinear mixture model frequently used to determine the class
proportions of mixed pixels or perform fuzzy classification (see Sect. 2.6.4 in
Chap. 2) in the image.
4.4.1
Feature Extraction Based Model
Let us construct a vector space of size equal to the number of spectral bands.
A pixel vector in the hyperspectral image is a point in such a space, with each
coordinate given by the corresponding intensity value (Richards and Jia 1999).
The visualization of the image cube plotted in the vector space provides useful
information related to the data. In the two-dimensional case, a grouping of the
points along a line segment signifies that the bands are highly correlated. This
is usually the case with adjacent bands in a hyperspectral image cube since
the adjacency of corresponding spectral bandwidths does not yield a major
change in the reflectance of the objects (see Fig. 4.4a). On the other hand, for
spectral bands with spectral wavelength ranges that are very distant, the plot
of corresponding bands will have scattered points. This is the situation shown
in Fig. 4.4b where the two bands belong to different spectral ranges (visible
7500
7000
6500
4500 5000 5500 IlOOO 6500 7000 7500 8000
a
9000
8000
7000
IlOOO
5000
4000
3000
~
...
4000
5000
IlOOO
7000
8000
b
Fig.4.4a,b. Model of a hyperspectral image as a random vector. a Two dimensional plot of
the pixel vectors for adjacent bands (blue and green). b Two-dimensional plot for the distant
bands (green and near infrared). The range for pixel values is due to the calibration process
that transformed the raw data to compensate for illumination conditions, angle of view, etc.