

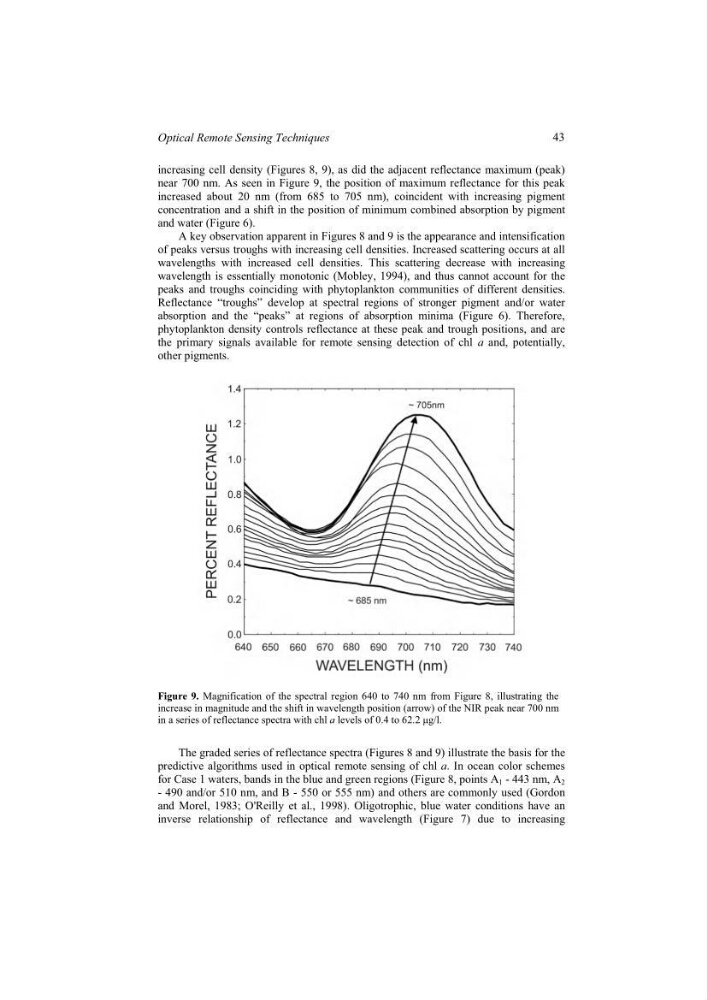
increasing cell density (Figures 8, 9), as did the adjacent reflectance maximum (peak)
near 700 nm. As seen in Figure 9, the position of maximum reflectance for this peak
increased about 20 nm (from 685 to 705 nm), coincident with increasing pigment
concentration and a shift in the position of minimum combined absorption by pigment
and water (Figure 6).
A key observation apparent in Figures 8 and 9 is the appearance and intensification
of peaks versus troughs with increasing cell densities. Increased scattering occurs at all
wavelengths with increased cell densities. This scattering decrease with increasing
wavelength is essentially monotonic (Mobley, 1994), and thus cannot account for the
peaks and troughs coinciding with phytoplankton communities of different densities.
Reflectance “troughs” develop at spectral regions of stronger pigment and/or water
absorption and the “peaks” at regions of absorption minima (Figure 6). Therefore,
phytoplankton density controls reflectance at these peak and trough positions, and are
the primary signals available for remote sensing detection of chl a and, potentially,
other pigments.
Figure 9. Magnification of the spectral region 640 to 740 nm from Figure 8, illustrating the
increase in magnitude and the shift in wavelength position (arrow) of the NIR peak near 700 nm
in a series of reflectance spectra with chl a levels of 0.4 to 62.2 µg/l.
The graded series of reflectance spectra (Figures 8 and 9) illustrate the basis for the
predictive algorithms used in optical remote sensing of chl a. In ocean color schemes
for Case 1 waters, bands in the blue and green regions (Figure 8, points A 1 - 443 nm, A 2
- 490 and/or 510 nm, and B - 550 or 555 nm) and others are commonly used (Gordon
and Morel, 1983; O'Reilly et al., 1998). Oligotrophic, blue water conditions have an
inverse relationship of reflectance and wavelength (Figure 7) due to increasing
43
Optical Remote Sensing Techniques
near 700 nm. As seen in Figure 9, the position of maximum reflectance for this peak
increased about 20 nm (from 685 to 705 nm), coincident with increasing pigment
concentration and a shift in the position of minimum combined absorption by pigment
and water (Figure 6).
A key observation apparent in Figures 8 and 9 is the appearance and intensification
of peaks versus troughs with increasing cell densities. Increased scattering occurs at all
wavelengths with increased cell densities. This scattering decrease with increasing
wavelength is essentially monotonic (Mobley, 1994), and thus cannot account for the
peaks and troughs coinciding with phytoplankton communities of different densities.
Reflectance “troughs” develop at spectral regions of stronger pigment and/or water
absorption and the “peaks” at regions of absorption minima (Figure 6). Therefore,
phytoplankton density controls reflectance at these peak and trough positions, and are
the primary signals available for remote sensing detection of chl a and, potentially,
other pigments.
Figure 9. Magnification of the spectral region 640 to 740 nm from Figure 8, illustrating the
increase in magnitude and the shift in wavelength position (arrow) of the NIR peak near 700 nm
in a series of reflectance spectra with chl a levels of 0.4 to 62.2 µg/l.
The graded series of reflectance spectra (Figures 8 and 9) illustrate the basis for the
predictive algorithms used in optical remote sensing of chl a. In ocean color schemes
for Case 1 waters, bands in the blue and green regions (Figure 8, points A 1 - 443 nm, A 2
- 490 and/or 510 nm, and B - 550 or 555 nm) and others are commonly used (Gordon
and Morel, 1983; O'Reilly et al., 1998). Oligotrophic, blue water conditions have an
inverse relationship of reflectance and wavelength (Figure 7) due to increasing
43
Optical Remote Sensing Techniques