

evidence that pigment absorption was dominant. Note that peak reflectance was about
1.5% at 400 nm, which is much lower than the 8.8% value for the Caribbean station in
Figure 7 in the absence of deep water scattering. The chl a concentration was more than
an order of magnitude greater in the tank compared to the Caribbean blue water
example, and the black bottom of this tank, at a depth of 3.2 m, was visible in the clear
water tank. At all wavelengths above 510 nm, reflectance increased with increasing cell
density, although the magnitude of increase varied as a function of wavelength
dependent absorption behaviors. Bukata et al. (1995) demonstrated similar results when
their multi-component optical model for natural waters was parameterized with no
CDOM present and no, or very low, amounts of suspended matter (tripton). With no
CDOM or tripton present, their spectral pivot point occurred at 497 nm, the wavelength
for which the ratio of (b b ) chl / a chl = (b b ) w / a w (where b b = backscatter, a = absorption, chl
= an average phytoplankton condition, and w = pure water). Their modeled hinge point
shifted to 528 nm with the addition of 0.1 mg/l tripton and to much higher wavelengths
with higher tripton concentrations. Their model is also sensitive to the optical
characteristics of the phytoplankton parameterization.
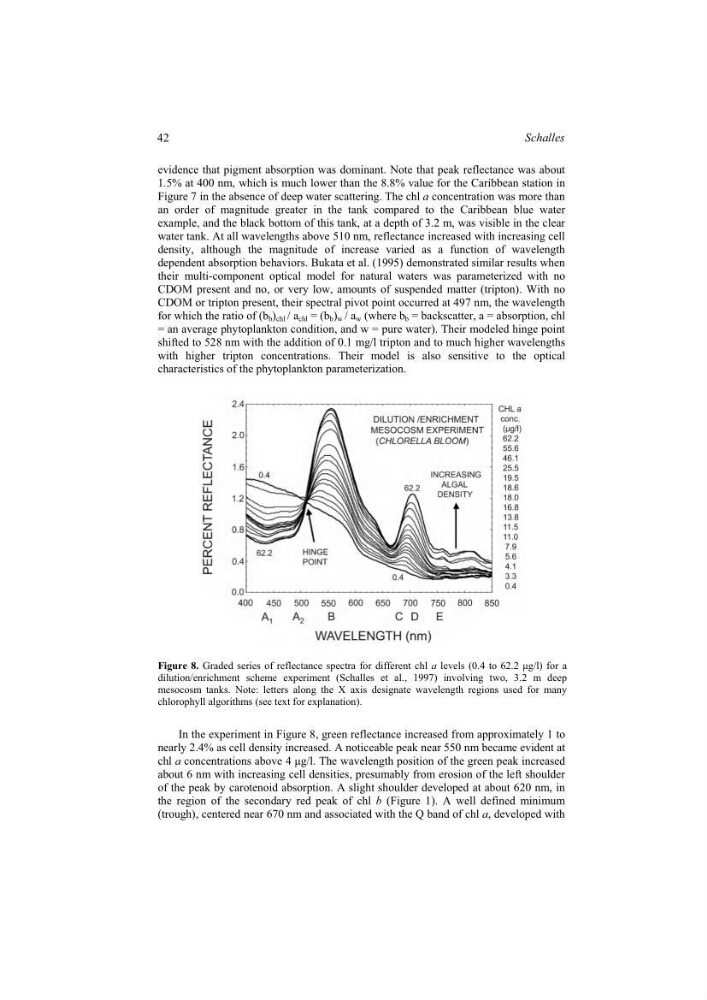
Figure 8. Graded series of reflectance spectra for different chl a levels (0.4 to 62.2 µg/l) for a
dilution/enrichment scheme experiment (Schalles et al., 1997) involving two, 3.2 m deep
mesocosm tanks. Note: letters along the X axis designate wavelength regions used for many
chlorophyll algorithms (see text for explanation).
In the experiment in Figure 8, green reflectance increased from approximately 1 to
nearly 2.4% as cell density increased. A noticeable peak near 550 nm became evident at
chl a concentrations above 4 µg/l. The wavelength position of the green peak increased
about 6 nm with increasing cell densities, presumably from erosion of the left shoulder
of the peak by carotenoid absorption. A slight shoulder developed at about 620 nm, in
the region of the secondary red peak of chl b (Figure 1). A well defined minimum
(trough), centered near 670 nm and associated with the Q band of chl a, developed with
42
Schalles
1.5% at 400 nm, which is much lower than the 8.8% value for the Caribbean station in
Figure 7 in the absence of deep water scattering. The chl a concentration was more than
an order of magnitude greater in the tank compared to the Caribbean blue water
example, and the black bottom of this tank, at a depth of 3.2 m, was visible in the clear
water tank. At all wavelengths above 510 nm, reflectance increased with increasing cell
density, although the magnitude of increase varied as a function of wavelength
dependent absorption behaviors. Bukata et al. (1995) demonstrated similar results when
their multi-component optical model for natural waters was parameterized with no
CDOM present and no, or very low, amounts of suspended matter (tripton). With no
CDOM or tripton present, their spectral pivot point occurred at 497 nm, the wavelength
for which the ratio of (b b ) chl / a chl = (b b ) w / a w (where b b = backscatter, a = absorption, chl
= an average phytoplankton condition, and w = pure water). Their modeled hinge point
shifted to 528 nm with the addition of 0.1 mg/l tripton and to much higher wavelengths
with higher tripton concentrations. Their model is also sensitive to the optical
characteristics of the phytoplankton parameterization.
Figure 8. Graded series of reflectance spectra for different chl a levels (0.4 to 62.2 µg/l) for a
dilution/enrichment scheme experiment (Schalles et al., 1997) involving two, 3.2 m deep
mesocosm tanks. Note: letters along the X axis designate wavelength regions used for many
chlorophyll algorithms (see text for explanation).
In the experiment in Figure 8, green reflectance increased from approximately 1 to
nearly 2.4% as cell density increased. A noticeable peak near 550 nm became evident at
chl a concentrations above 4 µg/l. The wavelength position of the green peak increased
about 6 nm with increasing cell densities, presumably from erosion of the left shoulder
of the peak by carotenoid absorption. A slight shoulder developed at about 620 nm, in
the region of the secondary red peak of chl b (Figure 1). A well defined minimum
(trough), centered near 670 nm and associated with the Q band of chl a, developed with
42
Schalles