

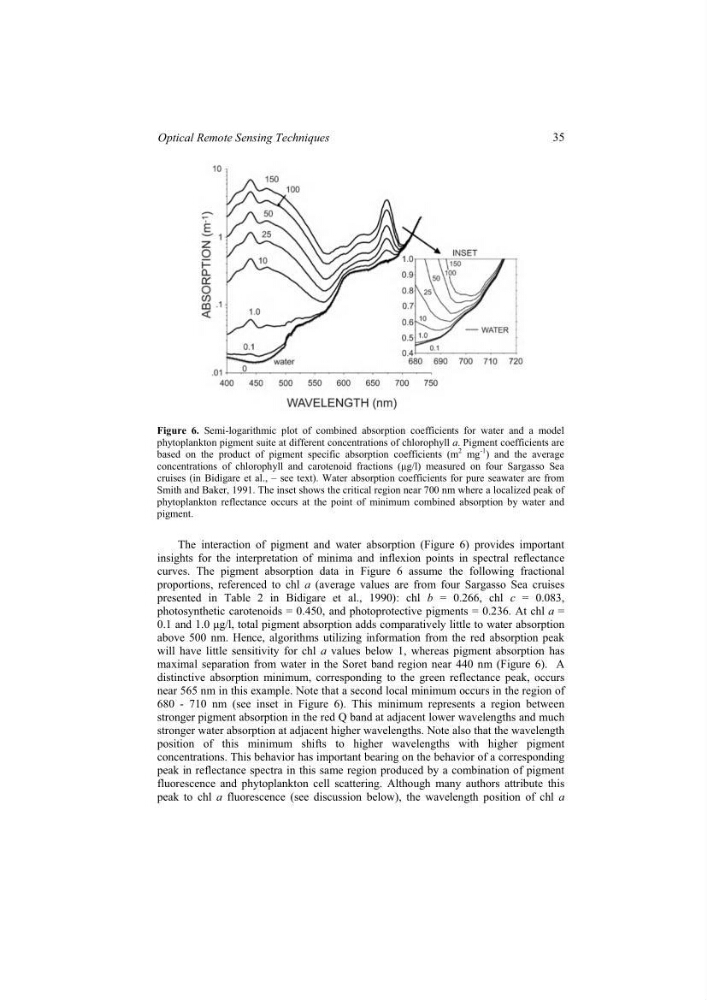
Figure 6. Semi-logarithmic plot of combined absorption coefficients for water and a model
phytoplankton pigment suite at different concentrations of chlorophyll a. Pigment coefficients are
based on the product of pigment specific absorption coefficients (m
2 mg
-1
) and the average
concentrations of chlorophyll and carotenoid fractions (µg/l) measured on four Sargasso Sea
cruises (in Bidigare et al., – see text). Water absorption coefficients for pure seawater are from
Smith and Baker, 1991. The inset shows the critical region near 700 nm where a localized peak of
phytoplankton reflectance occurs at the point of minimum combined absorption by water and
pigment.
The interaction of pigment and water absorption (Figure 6) provides important
insights for the interpretation of minima and inflexion points in spectral reflectance
curves. The pigment absorption data in Figure 6 assume the following fractional
proportions, referenced to chl a (average values are from four Sargasso Sea cruises
presented in Table 2 in Bidigare et al., 1990): chl b = 0.266, chl c = 0.083,
photosynthetic carotenoids = 0.450, and photoprotective pigments = 0.236. At chl a =
0.1 and 1.0 µg/l, total pigment absorption adds comparatively little to water absorption
above 500 nm. Hence, algorithms utilizing information from the red absorption peak
will have little sensitivity for chl a values below 1, whereas pigment absorption has
maximal separation from water in the Soret band region near 440 nm (Figure 6). A
distinctive absorption minimum, corresponding to the green reflectance peak, occurs
near 565 nm in this example. Note that a second local minimum occurs in the region of
680 - 710 nm (see inset in Figure 6). This minimum represents a region between
stronger pigment absorption in the red Q band at adjacent lower wavelengths and much
stronger water absorption at adjacent higher wavelengths. Note also that the wavelength
position of this minimum shifts to higher wavelengths with higher pigment
concentrations. This behavior has important bearing on the behavior of a corresponding
peak in reflectance spectra in this same region produced by a combination of pigment
fluorescence and phytoplankton cell scattering. Although many authors attribute this
peak to chl a fluorescence (see discussion below), the wavelength position of chl a
35
Optical Remote Sensing Techniques
phytoplankton pigment suite at different concentrations of chlorophyll a. Pigment coefficients are
based on the product of pigment specific absorption coefficients (m
2 mg
-1
) and the average
concentrations of chlorophyll and carotenoid fractions (µg/l) measured on four Sargasso Sea
cruises (in Bidigare et al., – see text). Water absorption coefficients for pure seawater are from
Smith and Baker, 1991. The inset shows the critical region near 700 nm where a localized peak of
phytoplankton reflectance occurs at the point of minimum combined absorption by water and
pigment.
The interaction of pigment and water absorption (Figure 6) provides important
insights for the interpretation of minima and inflexion points in spectral reflectance
curves. The pigment absorption data in Figure 6 assume the following fractional
proportions, referenced to chl a (average values are from four Sargasso Sea cruises
presented in Table 2 in Bidigare et al., 1990): chl b = 0.266, chl c = 0.083,
photosynthetic carotenoids = 0.450, and photoprotective pigments = 0.236. At chl a =
0.1 and 1.0 µg/l, total pigment absorption adds comparatively little to water absorption
above 500 nm. Hence, algorithms utilizing information from the red absorption peak
will have little sensitivity for chl a values below 1, whereas pigment absorption has
maximal separation from water in the Soret band region near 440 nm (Figure 6). A
distinctive absorption minimum, corresponding to the green reflectance peak, occurs
near 565 nm in this example. Note that a second local minimum occurs in the region of
680 - 710 nm (see inset in Figure 6). This minimum represents a region between
stronger pigment absorption in the red Q band at adjacent lower wavelengths and much
stronger water absorption at adjacent higher wavelengths. Note also that the wavelength
position of this minimum shifts to higher wavelengths with higher pigment
concentrations. This behavior has important bearing on the behavior of a corresponding
peak in reflectance spectra in this same region produced by a combination of pigment
fluorescence and phytoplankton cell scattering. Although many authors attribute this
peak to chl a fluorescence (see discussion below), the wavelength position of chl a
35
Optical Remote Sensing Techniques