

curves (obtained by all combinations of parameter values) forms an M dimensional
surface. That point on the surface where the residuum is minimal represents the solution
of the fit problem. The Simplex can be compared to a spider which crawls on the
surface searching for the minimum. It consists of M+1 legs, where each leg (vertex)
represents a model curve that has already been calculated. The decision regarding
which set of parameter values is chosen in the next step (i.e. where the Simplex moves
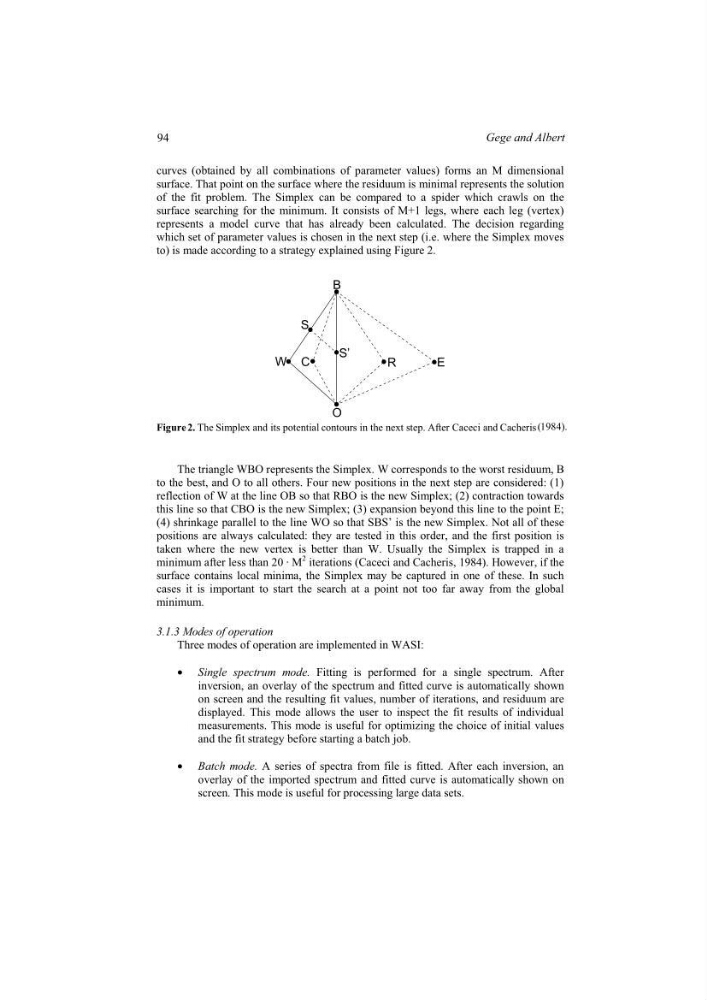
to) is made according to a strategy explained using Figure 2.
R
O
W
S
B
C
S’
E
Figure 2. The Simplex and its potential contours in the next step. After Caceci and Cacheris (1984).
The triangle WBO represents the Simplex. W corresponds to the worst residuum, B
to the best, and O to all others. Four new positions in the next step are considered: (1)
reflection of W at the line OB so that RBO is the new Simplex; (2) contraction towards
this line so that CBO is the new Simplex; (3) expansion beyond this line to the point E;
(4) shrinkage parallel to the line WO so that SBS’ is the new Simplex. Not all of these
positions are always calculated: they are tested in this order, and the first position is
taken where the new vertex is better than W. Usually the Simplex is trapped in a
minimum after less than 20 · M
2 iterations (Caceci and Cacheris, 1984). However, if the
surface contains local minima, the Simplex may be captured in one of these. In such
cases it is important to start the search at a point not too far away from the global
minimum.
3.1.3 Modes of operation
Three modes of operation are implemented in WASI:
• Single spectrum mode. Fitting is performed for a single spectrum. After
inversion, an overlay of the spectrum and fitted curve is automatically shown
on screen and the resulting fit values, number of iterations, and residuum are
displayed. This mode allows the user to inspect the fit results of individual
measurements. This mode is useful for optimizing the choice of initial values
and the fit strategy before starting a batch job.
• Batch mode. A series of spectra from file is fitted. After each inversion, an
overlay of the imported spectrum and fitted curve is automatically shown on
screen. This mode is useful for processing large data sets.
94
Gege and Albert
surface. That point on the surface where the residuum is minimal represents the solution
of the fit problem. The Simplex can be compared to a spider which crawls on the
surface searching for the minimum. It consists of M+1 legs, where each leg (vertex)
represents a model curve that has already been calculated. The decision regarding
which set of parameter values is chosen in the next step (i.e. where the Simplex moves
to) is made according to a strategy explained using Figure 2.
R
O
W
S
B
C
S’
E
Figure 2. The Simplex and its potential contours in the next step. After Caceci and Cacheris (1984).
The triangle WBO represents the Simplex. W corresponds to the worst residuum, B
to the best, and O to all others. Four new positions in the next step are considered: (1)
reflection of W at the line OB so that RBO is the new Simplex; (2) contraction towards
this line so that CBO is the new Simplex; (3) expansion beyond this line to the point E;
(4) shrinkage parallel to the line WO so that SBS’ is the new Simplex. Not all of these
positions are always calculated: they are tested in this order, and the first position is
taken where the new vertex is better than W. Usually the Simplex is trapped in a
minimum after less than 20 · M
2 iterations (Caceci and Cacheris, 1984). However, if the
surface contains local minima, the Simplex may be captured in one of these. In such
cases it is important to start the search at a point not too far away from the global
minimum.
3.1.3 Modes of operation
Three modes of operation are implemented in WASI:
• Single spectrum mode. Fitting is performed for a single spectrum. After
inversion, an overlay of the spectrum and fitted curve is automatically shown
on screen and the resulting fit values, number of iterations, and residuum are
displayed. This mode allows the user to inspect the fit results of individual
measurements. This mode is useful for optimizing the choice of initial values
and the fit strategy before starting a batch job.
• Batch mode. A series of spectra from file is fitted. After each inversion, an
overlay of the imported spectrum and fitted curve is automatically shown on
screen. This mode is useful for processing large data sets.
94
Gege and Albert