

et al. (2001) used SeaWiFS data to show significant differences in the monthly
mean Chl over the global ocean between the El Niño and the subsequent La Niña
year due to altered ocean nutrient distributions. Low Chl levels during the El Niño
were followed by a 10 % increase between September 1997 and December 1998.
Moreover, such changes were not restricted to the equatorial Pacific but rather
spread in the global ocean. During the subsequent La Niña period of January
1999–August 2000, global mean Chl continued to increase but at a slower annual
rate of 2.2 %, and such increases primarily occurred in the Pacific Ocean.
The global ocean Chl response to ENSO was further detailed in Yoder and
Kennelly (2003), and the biological response to the 1997–1998 El Niño in the
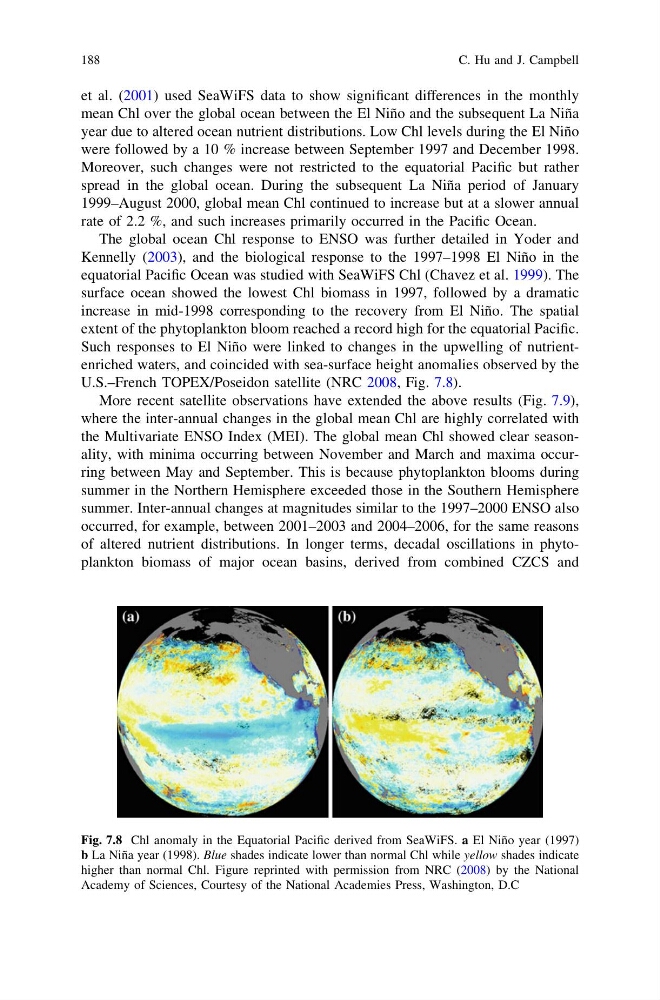
equatorial Pacific Ocean was studied with SeaWiFS Chl (Chavez et al. 1999). The
surface ocean showed the lowest Chl biomass in 1997, followed by a dramatic
increase in mid-1998 corresponding to the recovery from El Niño. The spatial
extent of the phytoplankton bloom reached a record high for the equatorial Pacific.
Such responses to El Niño were linked to changes in the upwelling of nutrientenriched waters, and coincided with sea-surface height anomalies observed by the
U.S.–French TOPEX/Poseidon satellite (NRC 2008, Fig. 7.8).
More recent satellite observations have extended the above results (Fig. 7.9),
where the inter-annual changes in the global mean Chl are highly correlated with
the Multivariate ENSO Index (MEI). The global mean Chl showed clear seasonality, with minima occurring between November and March and maxima occurring between May and September. This is because phytoplankton blooms during
summer in the Northern Hemisphere exceeded those in the Southern Hemisphere
summer. Inter-annual changes at magnitudes similar to the 1997–2000 ENSO also
occurred, for example, between 2001–2003 and 2004–2006, for the same reasons
of altered nutrient distributions. In longer terms, decadal oscillations in phytoplankton biomass of major ocean basins, derived from combined CZCS and
Fig. 7.8 Chl anomaly in the Equatorial Pacific derived from SeaWiFS. a El Niño year (1997)
b La Niña year (1998). Blue shades indicate lower than normal Chl while yellow shades indicate
higher than normal Chl. Figure reprinted with permission from NRC (2008) by the National
Academy of Sciences, Courtesy of the National Academies Press, Washington, D.C
188
C. Hu and J. Campbell
mean Chl over the global ocean between the El Niño and the subsequent La Niña
year due to altered ocean nutrient distributions. Low Chl levels during the El Niño
were followed by a 10 % increase between September 1997 and December 1998.
Moreover, such changes were not restricted to the equatorial Pacific but rather
spread in the global ocean. During the subsequent La Niña period of January
1999–August 2000, global mean Chl continued to increase but at a slower annual
rate of 2.2 %, and such increases primarily occurred in the Pacific Ocean.
The global ocean Chl response to ENSO was further detailed in Yoder and
Kennelly (2003), and the biological response to the 1997–1998 El Niño in the
equatorial Pacific Ocean was studied with SeaWiFS Chl (Chavez et al. 1999). The
surface ocean showed the lowest Chl biomass in 1997, followed by a dramatic
increase in mid-1998 corresponding to the recovery from El Niño. The spatial
extent of the phytoplankton bloom reached a record high for the equatorial Pacific.
Such responses to El Niño were linked to changes in the upwelling of nutrientenriched waters, and coincided with sea-surface height anomalies observed by the
U.S.–French TOPEX/Poseidon satellite (NRC 2008, Fig. 7.8).
More recent satellite observations have extended the above results (Fig. 7.9),
where the inter-annual changes in the global mean Chl are highly correlated with
the Multivariate ENSO Index (MEI). The global mean Chl showed clear seasonality, with minima occurring between November and March and maxima occurring between May and September. This is because phytoplankton blooms during
summer in the Northern Hemisphere exceeded those in the Southern Hemisphere
summer. Inter-annual changes at magnitudes similar to the 1997–2000 ENSO also
occurred, for example, between 2001–2003 and 2004–2006, for the same reasons
of altered nutrient distributions. In longer terms, decadal oscillations in phytoplankton biomass of major ocean basins, derived from combined CZCS and
Fig. 7.8 Chl anomaly in the Equatorial Pacific derived from SeaWiFS. a El Niño year (1997)
b La Niña year (1998). Blue shades indicate lower than normal Chl while yellow shades indicate
higher than normal Chl. Figure reprinted with permission from NRC (2008) by the National
Academy of Sciences, Courtesy of the National Academies Press, Washington, D.C
188
C. Hu and J. Campbell