

and upwelling, to monitor harmful algal blooms (HABs) and pollution events such
as oil spills, to document coastal water quality changes, to assess ocean fishery and
other resources, and to help make management decisions. Yet, to date, the single
most-often used parameter from these satellite missions is the surface ocean
chlorophyll-a concentration (Chl in mg m
-3 ), which has often been used interchangeably with the term ‘‘ocean color.’’
Here, based on the most recent research findings from the ocean color community, a brief review is provided on how Chl is derived from satellite measurements and how Chl maps help to understand global ocean biology and
biogeochemistry, regional oceanography, and coastal water quality changes. This
chapter is not meant to present a comprehensive list of all possible topics enabled
by satellite-based Chl observations, but rather its focus is on the methods of Chl
retrievals with several examples showing major findings. Interested readers may
read the refereed literature and technical reports compiled by the International
Ocean Colour Coordinating Group (http://www.ioccg.org) to get a full breadth and
depth of knowledge in the various aspects of ocean color remote sensing.
7.2 Theoretical Basis
The theory of ocean optics and optical remote sensing has been described in
numerous textbooks and articles (e.g., Gordon and Morel 1983; Mobley 1994;
Morel and Maritorena 2001). Conceptually, the dominant material affecting ocean
color is the water itself, which scatters blue light and absorbs red light. Variability
in ocean color is determined by the light absorption and scattering properties of the
materials suspended and dissolved in the upper ocean. Over most of the ocean, the
only suspended materials are microscopic algae, known as phytoplankton, and
organic matter produced by the algae. The ubiquitous green pigment chlorophyll
a is found in all phytoplankton, as in other photosynthetic plants, and its concentration has traditionally been used as a measure of phytoplankton biomass. In
the simplest terms, waters low in Chl are blue whereas waters with higher Chl are
green. This basic concept led to the premise that remote sensing measurements of
blue and green reflectance could be used to quantify Chl in the surface ocean.
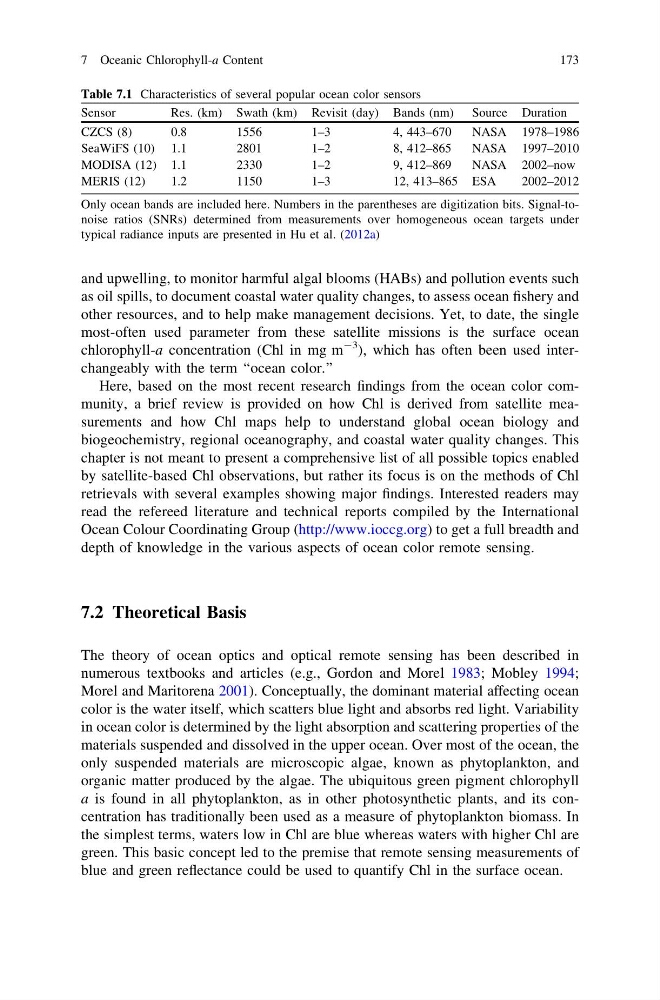
Table 7.1 Characteristics of several popular ocean color sensors
Sensor
Res. (km) Swath (km) Revisit (day) Bands (nm) Source Duration
CZCS (8)
0.8
1556
1–3
4, 443–670
NASA 1978–1986
SeaWiFS (10) 1.1
2801
1–2
8, 412–865
NASA 1997–2010
MODISA (12) 1.1
2330
1–2
9, 412–869
NASA 2002–now
MERIS (12)
1.2
1150
1–3
12, 413–865 ESA
2002–2012
Only ocean bands are included here. Numbers in the parentheses are digitization bits. Signal-tonoise ratios (SNRs) determined from measurements over homogeneous ocean targets under
typical radiance inputs are presented in Hu et al. (2012a)
7 Oceanic Chlorophyll-a Content
173
as oil spills, to document coastal water quality changes, to assess ocean fishery and
other resources, and to help make management decisions. Yet, to date, the single
most-often used parameter from these satellite missions is the surface ocean
chlorophyll-a concentration (Chl in mg m
-3 ), which has often been used interchangeably with the term ‘‘ocean color.’’
Here, based on the most recent research findings from the ocean color community, a brief review is provided on how Chl is derived from satellite measurements and how Chl maps help to understand global ocean biology and
biogeochemistry, regional oceanography, and coastal water quality changes. This
chapter is not meant to present a comprehensive list of all possible topics enabled
by satellite-based Chl observations, but rather its focus is on the methods of Chl
retrievals with several examples showing major findings. Interested readers may
read the refereed literature and technical reports compiled by the International
Ocean Colour Coordinating Group (http://www.ioccg.org) to get a full breadth and
depth of knowledge in the various aspects of ocean color remote sensing.
7.2 Theoretical Basis
The theory of ocean optics and optical remote sensing has been described in
numerous textbooks and articles (e.g., Gordon and Morel 1983; Mobley 1994;
Morel and Maritorena 2001). Conceptually, the dominant material affecting ocean
color is the water itself, which scatters blue light and absorbs red light. Variability
in ocean color is determined by the light absorption and scattering properties of the
materials suspended and dissolved in the upper ocean. Over most of the ocean, the
only suspended materials are microscopic algae, known as phytoplankton, and
organic matter produced by the algae. The ubiquitous green pigment chlorophyll
a is found in all phytoplankton, as in other photosynthetic plants, and its concentration has traditionally been used as a measure of phytoplankton biomass. In
the simplest terms, waters low in Chl are blue whereas waters with higher Chl are
green. This basic concept led to the premise that remote sensing measurements of
blue and green reflectance could be used to quantify Chl in the surface ocean.
Table 7.1 Characteristics of several popular ocean color sensors
Sensor
Res. (km) Swath (km) Revisit (day) Bands (nm) Source Duration
CZCS (8)
0.8
1556
1–3
4, 443–670
NASA 1978–1986
SeaWiFS (10) 1.1
2801
1–2
8, 412–865
NASA 1997–2010
MODISA (12) 1.1
2330
1–2
9, 412–869
NASA 2002–now
MERIS (12)
1.2
1150
1–3
12, 413–865 ESA
2002–2012
Only ocean bands are included here. Numbers in the parentheses are digitization bits. Signal-tonoise ratios (SNRs) determined from measurements over homogeneous ocean targets under
typical radiance inputs are presented in Hu et al. (2012a)
7 Oceanic Chlorophyll-a Content
173