

(C 3 ) rotation cropland with the VPM model to illustrate the PEM simulation and
validation processes.
Our study site is the Mead site at the University of Nebraska Agricultural
Research and Development Center, near Mead, Nebraska, U.S.A. The site is at the
western edge of the favorably rain-fed corn belt, and it has a deep, silty clay-loam
soil texture and a temperate continental climate. The plant growing season starts in
May and ends in October. It covers 524 000 m
2 and rotates between maize and
soybean cultivation via a center-pivot irrigation system. The maize canopy height
is up to 2.9 m. The eddy covariance flux measurement height is 3 m when the
canopy height is less than 1 m, and is adjusted to 6 m after the canopy height is
greater than 1 m until the harvest period (Verma et al. 2005). During the study
period of 2001–2005, maize was cultivated in 2001, 2003, and 2005, and soybeans
were cultivated in 2002 and 2004.
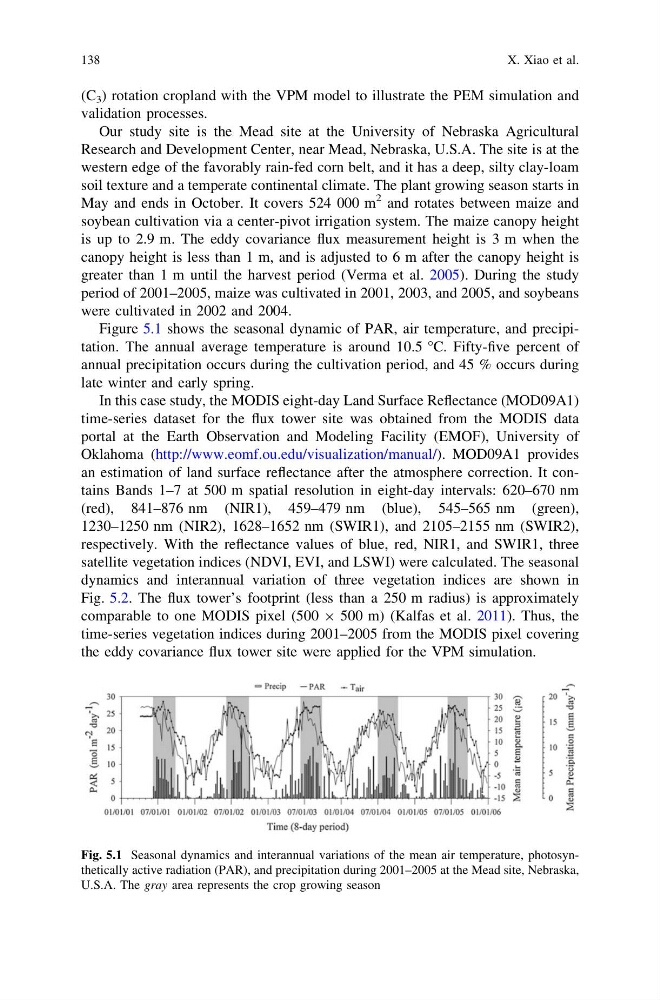
Figure 5.1 shows the seasonal dynamic of PAR, air temperature, and precipitation. The annual average temperature is around 10.5 °C. Fifty-five percent of
annual precipitation occurs during the cultivation period, and 45 % occurs during
late winter and early spring.
In this case study, the MODIS eight-day Land Surface Reflectance (MOD09A1)
time-series dataset for the flux tower site was obtained from the MODIS data
portal at the Earth Observation and Modeling Facility (EMOF), University of
Oklahoma (http://www.eomf.ou.edu/visualization/manual/). MOD09A1 provides
an estimation of land surface reflectance after the atmosphere correction. It contains Bands 1–7 at 500 m spatial resolution in eight-day intervals: 620–670 nm
(red), 841–876 nm (NIR1), 459–479 nm (blue), 545–565 nm (green),
1230–1250 nm (NIR2), 1628–1652 nm (SWIR1), and 2105–2155 nm (SWIR2),
respectively. With the reflectance values of blue, red, NIR1, and SWIR1, three
satellite vegetation indices (NDVI, EVI, and LSWI) were calculated. The seasonal
dynamics and interannual variation of three vegetation indices are shown in
Fig. 5.2. The flux tower’s footprint (less than a 250 m radius) is approximately
comparable to one MODIS pixel (500 9 500 m) (Kalfas et al. 2011). Thus, the
time-series vegetation indices during 2001–2005 from the MODIS pixel covering
the eddy covariance flux tower site were applied for the VPM simulation.
Fig. 5.1 Seasonal dynamics and interannual variations of the mean air temperature, photosynthetically active radiation (PAR), and precipitation during 2001–2005 at the Mead site, Nebraska,
U.S.A. The gray area represents the crop growing season
138
X. Xiao et al.
validation processes.
Our study site is the Mead site at the University of Nebraska Agricultural
Research and Development Center, near Mead, Nebraska, U.S.A. The site is at the
western edge of the favorably rain-fed corn belt, and it has a deep, silty clay-loam
soil texture and a temperate continental climate. The plant growing season starts in
May and ends in October. It covers 524 000 m
2 and rotates between maize and
soybean cultivation via a center-pivot irrigation system. The maize canopy height
is up to 2.9 m. The eddy covariance flux measurement height is 3 m when the
canopy height is less than 1 m, and is adjusted to 6 m after the canopy height is
greater than 1 m until the harvest period (Verma et al. 2005). During the study
period of 2001–2005, maize was cultivated in 2001, 2003, and 2005, and soybeans
were cultivated in 2002 and 2004.
Figure 5.1 shows the seasonal dynamic of PAR, air temperature, and precipitation. The annual average temperature is around 10.5 °C. Fifty-five percent of
annual precipitation occurs during the cultivation period, and 45 % occurs during
late winter and early spring.
In this case study, the MODIS eight-day Land Surface Reflectance (MOD09A1)
time-series dataset for the flux tower site was obtained from the MODIS data
portal at the Earth Observation and Modeling Facility (EMOF), University of
Oklahoma (http://www.eomf.ou.edu/visualization/manual/). MOD09A1 provides
an estimation of land surface reflectance after the atmosphere correction. It contains Bands 1–7 at 500 m spatial resolution in eight-day intervals: 620–670 nm
(red), 841–876 nm (NIR1), 459–479 nm (blue), 545–565 nm (green),
1230–1250 nm (NIR2), 1628–1652 nm (SWIR1), and 2105–2155 nm (SWIR2),
respectively. With the reflectance values of blue, red, NIR1, and SWIR1, three
satellite vegetation indices (NDVI, EVI, and LSWI) were calculated. The seasonal
dynamics and interannual variation of three vegetation indices are shown in
Fig. 5.2. The flux tower’s footprint (less than a 250 m radius) is approximately
comparable to one MODIS pixel (500 9 500 m) (Kalfas et al. 2011). Thus, the
time-series vegetation indices during 2001–2005 from the MODIS pixel covering
the eddy covariance flux tower site were applied for the VPM simulation.
Fig. 5.1 Seasonal dynamics and interannual variations of the mean air temperature, photosynthetically active radiation (PAR), and precipitation during 2001–2005 at the Mead site, Nebraska,
U.S.A. The gray area represents the crop growing season
138
X. Xiao et al.