

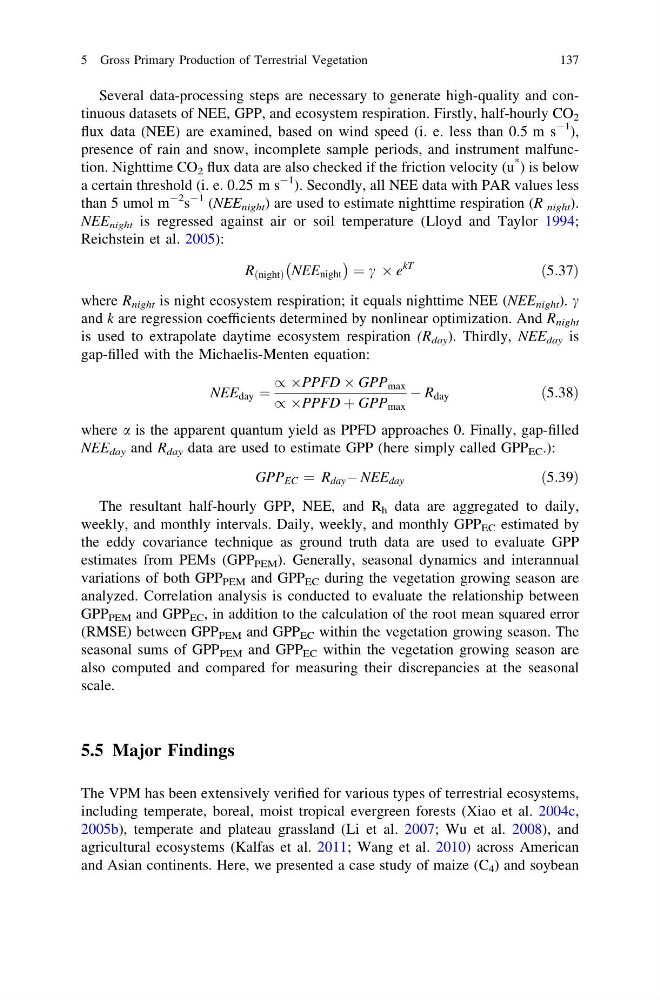
Several data-processing steps are necessary to generate high-quality and continuous datasets of NEE, GPP, and ecosystem respiration. Firstly, half-hourly CO 2
flux data (NEE) are examined, based on wind speed (i. e. less than 0.5 m s
-1 ),
presence of rain and snow, incomplete sample periods, and instrument malfunction. Nighttime CO 2 flux data are also checked if the friction velocity (u
* ) is below
a certain threshold (i. e. 0.25 m s
-1 ). Secondly, all NEE data with PAR values less
than 5 umol m
-2 s
-1 (NEE night ) are used to estimate nighttime respiration (R night ).
NEE night is regressed against air or soil temperature (Lloyd and Taylor 1994;
Reichstein et al. 2005):
R night
ð
Þ NEE night
À
Á
¼ c  e
kT
ð5:37Þ
where R night is night ecosystem respiration; it equals nighttime NEE (NEE night ). c
and k are regression coefficients determined by nonlinear optimization. And R night
is used to extrapolate daytime ecosystem respiration (R day ). Thirdly, NEE day is
gap-filled with the Michaelis-Menten equation:
NEE day ¼
/ ÂPPFD Â GPP max
/ ÂPPFD þ GPP max
À R day
ð5:38Þ
where a is the apparent quantum yield as PPFD approaches 0. Finally, gap-filled
NEE day and R day data are used to estimate GPP (here simply called GPP EC .):
GPP EC ¼ R day À NEE day
ð5:39Þ
The resultant half-hourly GPP, NEE, and R h data are aggregated to daily,
weekly, and monthly intervals. Daily, weekly, and monthly GPP EC estimated by
the eddy covariance technique as ground truth data are used to evaluate GPP
estimates from PEMs (GPP PEM ). Generally, seasonal dynamics and interannual
variations of both GPP PEM and GPP EC during the vegetation growing season are
analyzed. Correlation analysis is conducted to evaluate the relationship between
GPP PEM and GPP EC , in addition to the calculation of the root mean squared error
(RMSE) between GPP PEM and GPP EC within the vegetation growing season. The
seasonal sums of GPP PEM and GPP EC within the vegetation growing season are
also computed and compared for measuring their discrepancies at the seasonal
scale.
5.5 Major Findings
The VPM has been extensively verified for various types of terrestrial ecosystems,
including temperate, boreal, moist tropical evergreen forests (Xiao et al. 2004c,
2005b), temperate and plateau grassland (Li et al. 2007; Wu et al. 2008), and
agricultural ecosystems (Kalfas et al. 2011; Wang et al. 2010) across American
and Asian continents. Here, we presented a case study of maize (C 4 ) and soybean
5 Gross Primary Production of Terrestrial Vegetation
137
flux data (NEE) are examined, based on wind speed (i. e. less than 0.5 m s
-1 ),
presence of rain and snow, incomplete sample periods, and instrument malfunction. Nighttime CO 2 flux data are also checked if the friction velocity (u
* ) is below
a certain threshold (i. e. 0.25 m s
-1 ). Secondly, all NEE data with PAR values less
than 5 umol m
-2 s
-1 (NEE night ) are used to estimate nighttime respiration (R night ).
NEE night is regressed against air or soil temperature (Lloyd and Taylor 1994;
Reichstein et al. 2005):
R night
ð
Þ NEE night
À
Á
¼ c  e
kT
ð5:37Þ
where R night is night ecosystem respiration; it equals nighttime NEE (NEE night ). c
and k are regression coefficients determined by nonlinear optimization. And R night
is used to extrapolate daytime ecosystem respiration (R day ). Thirdly, NEE day is
gap-filled with the Michaelis-Menten equation:
NEE day ¼
/ ÂPPFD Â GPP max
/ ÂPPFD þ GPP max
À R day
ð5:38Þ
where a is the apparent quantum yield as PPFD approaches 0. Finally, gap-filled
NEE day and R day data are used to estimate GPP (here simply called GPP EC .):
GPP EC ¼ R day À NEE day
ð5:39Þ
The resultant half-hourly GPP, NEE, and R h data are aggregated to daily,
weekly, and monthly intervals. Daily, weekly, and monthly GPP EC estimated by
the eddy covariance technique as ground truth data are used to evaluate GPP
estimates from PEMs (GPP PEM ). Generally, seasonal dynamics and interannual
variations of both GPP PEM and GPP EC during the vegetation growing season are
analyzed. Correlation analysis is conducted to evaluate the relationship between
GPP PEM and GPP EC , in addition to the calculation of the root mean squared error
(RMSE) between GPP PEM and GPP EC within the vegetation growing season. The
seasonal sums of GPP PEM and GPP EC within the vegetation growing season are
also computed and compared for measuring their discrepancies at the seasonal
scale.
5.5 Major Findings
The VPM has been extensively verified for various types of terrestrial ecosystems,
including temperate, boreal, moist tropical evergreen forests (Xiao et al. 2004c,
2005b), temperate and plateau grassland (Li et al. 2007; Wu et al. 2008), and
agricultural ecosystems (Kalfas et al. 2011; Wang et al. 2010) across American
and Asian continents. Here, we presented a case study of maize (C 4 ) and soybean
5 Gross Primary Production of Terrestrial Vegetation
137