

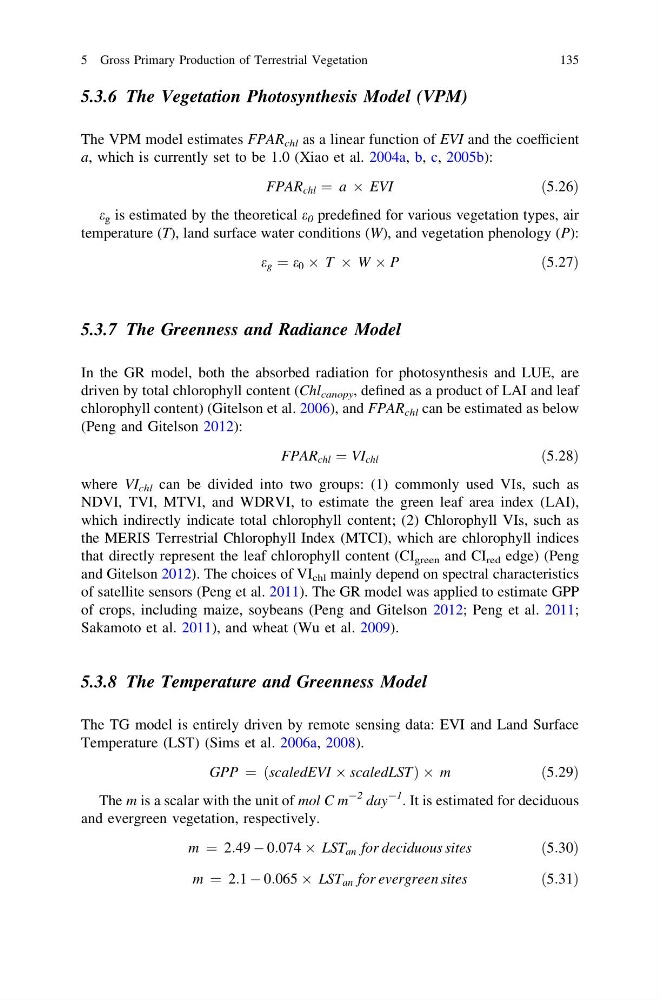
5.3.6 The Vegetation Photosynthesis Model (VPM)
The VPM model estimates FPAR chl as a linear function of EVI and the coefficient
a, which is currently set to be 1.0 (Xiao et al. 2004a, b, c, 2005b):
FPAR chl ¼ a  EVI
ð5:26Þ
e g is estimated by the theoretical e 0 predefined for various vegetation types, air
temperature (T), land surface water conditions (W), and vegetation phenology (P):
e g ¼ e 0 Â T Â W Â P
ð5:27Þ
5.3.7 The Greenness and Radiance Model
In the GR model, both the absorbed radiation for photosynthesis and LUE, are
driven by total chlorophyll content (Chl canopy , defined as a product of LAI and leaf
chlorophyll content) (Gitelson et al. 2006), and FPAR chl can be estimated as below
(Peng and Gitelson 2012):
FPAR chl ¼ VI chl
ð5:28Þ
where VI chl can be divided into two groups: (1) commonly used VIs, such as
NDVI, TVI, MTVI, and WDRVI, to estimate the green leaf area index (LAI),
which indirectly indicate total chlorophyll content; (2) Chlorophyll VIs, such as
the MERIS Terrestrial Chlorophyll Index (MTCI), which are chlorophyll indices
that directly represent the leaf chlorophyll content (CI green and CI red edge) (Peng
and Gitelson 2012). The choices of VI chl mainly depend on spectral characteristics
of satellite sensors (Peng et al. 2011). The GR model was applied to estimate GPP
of crops, including maize, soybeans (Peng and Gitelson 2012; Peng et al. 2011;
Sakamoto et al. 2011), and wheat (Wu et al. 2009).
5.3.8 The Temperature and Greenness Model
The TG model is entirely driven by remote sensing data: EVI and Land Surface
Temperature (LST) (Sims et al. 2006a, 2008).
GPP ¼ scaledEVI Â scaledLST
ð
Þ Â m
ð5:29Þ
The m is a scalar with the unit of mol C m
-2 day
-1 . It is estimated for deciduous
and evergreen vegetation, respectively.
m ¼ 2:49 À 0:074 Â LST an for deciduous sites
ð5:30Þ
m ¼ 2:1 À 0:065 Â LST an for evergreen sites
ð5:31Þ
5 Gross Primary Production of Terrestrial Vegetation
135
The VPM model estimates FPAR chl as a linear function of EVI and the coefficient
a, which is currently set to be 1.0 (Xiao et al. 2004a, b, c, 2005b):
FPAR chl ¼ a  EVI
ð5:26Þ
e g is estimated by the theoretical e 0 predefined for various vegetation types, air
temperature (T), land surface water conditions (W), and vegetation phenology (P):
e g ¼ e 0 Â T Â W Â P
ð5:27Þ
5.3.7 The Greenness and Radiance Model
In the GR model, both the absorbed radiation for photosynthesis and LUE, are
driven by total chlorophyll content (Chl canopy , defined as a product of LAI and leaf
chlorophyll content) (Gitelson et al. 2006), and FPAR chl can be estimated as below
(Peng and Gitelson 2012):
FPAR chl ¼ VI chl
ð5:28Þ
where VI chl can be divided into two groups: (1) commonly used VIs, such as
NDVI, TVI, MTVI, and WDRVI, to estimate the green leaf area index (LAI),
which indirectly indicate total chlorophyll content; (2) Chlorophyll VIs, such as
the MERIS Terrestrial Chlorophyll Index (MTCI), which are chlorophyll indices
that directly represent the leaf chlorophyll content (CI green and CI red edge) (Peng
and Gitelson 2012). The choices of VI chl mainly depend on spectral characteristics
of satellite sensors (Peng et al. 2011). The GR model was applied to estimate GPP
of crops, including maize, soybeans (Peng and Gitelson 2012; Peng et al. 2011;
Sakamoto et al. 2011), and wheat (Wu et al. 2009).
5.3.8 The Temperature and Greenness Model
The TG model is entirely driven by remote sensing data: EVI and Land Surface
Temperature (LST) (Sims et al. 2006a, 2008).
GPP ¼ scaledEVI Â scaledLST
ð
Þ Â m
ð5:29Þ
The m is a scalar with the unit of mol C m
-2 day
-1 . It is estimated for deciduous
and evergreen vegetation, respectively.
m ¼ 2:49 À 0:074 Â LST an for deciduous sites
ð5:30Þ
m ¼ 2:1 À 0:065 Â LST an for evergreen sites
ð5:31Þ
5 Gross Primary Production of Terrestrial Vegetation
135