

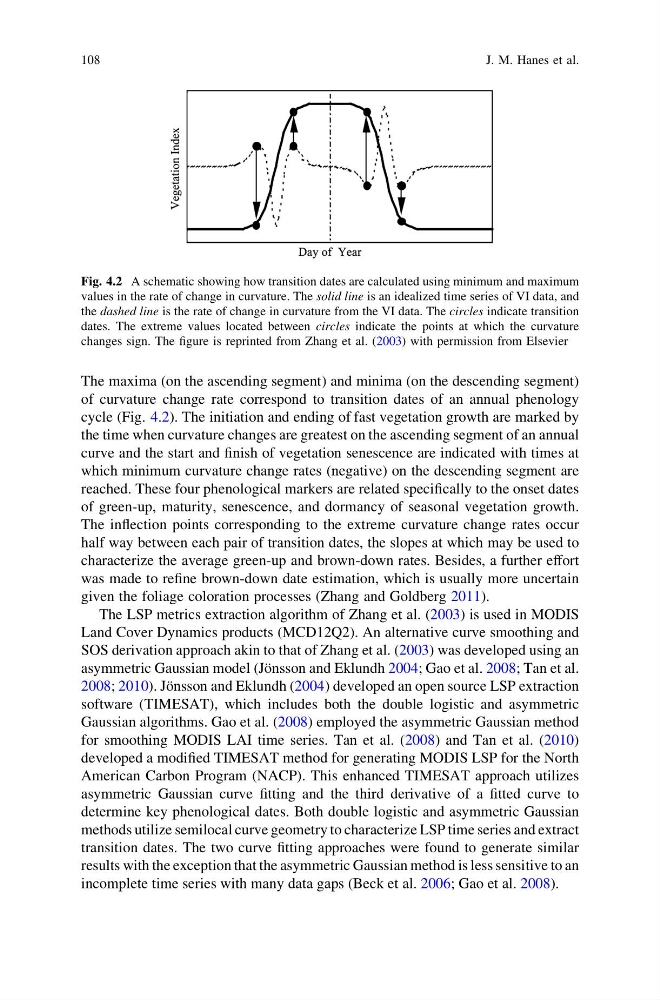
The maxima (on the ascending segment) and minima (on the descending segment)
of curvature change rate correspond to transition dates of an annual phenology
cycle (Fig. 4.2). The initiation and ending of fast vegetation growth are marked by
the time when curvature changes are greatest on the ascending segment of an annual
curve and the start and finish of vegetation senescence are indicated with times at
which minimum curvature change rates (negative) on the descending segment are
reached. These four phenological markers are related specifically to the onset dates
of green-up, maturity, senescence, and dormancy of seasonal vegetation growth.
The inflection points corresponding to the extreme curvature change rates occur
half way between each pair of transition dates, the slopes at which may be used to
characterize the average green-up and brown-down rates. Besides, a further effort
was made to refine brown-down date estimation, which is usually more uncertain
given the foliage coloration processes (Zhang and Goldberg 2011).
The LSP metrics extraction algorithm of Zhang et al. (2003) is used in MODIS
Land Cover Dynamics products (MCD12Q2). An alternative curve smoothing and
SOS derivation approach akin to that of Zhang et al. (2003) was developed using an
asymmetric Gaussian model (Jönsson and Eklundh 2004; Gao et al. 2008; Tan et al.
2008; 2010). Jönsson and Eklundh (2004) developed an open source LSP extraction
software (TIMESAT), which includes both the double logistic and asymmetric
Gaussian algorithms. Gao et al. (2008) employed the asymmetric Gaussian method
for smoothing MODIS LAI time series. Tan et al. (2008) and Tan et al. (2010)
developed a modified TIMESAT method for generating MODIS LSP for the North
American Carbon Program (NACP). This enhanced TIMESAT approach utilizes
asymmetric Gaussian curve fitting and the third derivative of a fitted curve to
determine key phenological dates. Both double logistic and asymmetric Gaussian
methods utilize semilocal curve geometry to characterize LSP time series and extract
transition dates. The two curve fitting approaches were found to generate similar
results with the exception that the asymmetric Gaussian method is less sensitive to an
incomplete time series with many data gaps (Beck et al. 2006; Gao et al. 2008).
Fig. 4.2 A schematic showing how transition dates are calculated using minimum and maximum
values in the rate of change in curvature. The solid line is an idealized time series of VI data, and
the dashed line is the rate of change in curvature from the VI data. The circles indicate transition
dates. The extreme values located between circles indicate the points at which the curvature
changes sign. The figure is reprinted from Zhang et al. (2003) with permission from Elsevier
108
J. M. Hanes et al.
of curvature change rate correspond to transition dates of an annual phenology
cycle (Fig. 4.2). The initiation and ending of fast vegetation growth are marked by
the time when curvature changes are greatest on the ascending segment of an annual
curve and the start and finish of vegetation senescence are indicated with times at
which minimum curvature change rates (negative) on the descending segment are
reached. These four phenological markers are related specifically to the onset dates
of green-up, maturity, senescence, and dormancy of seasonal vegetation growth.
The inflection points corresponding to the extreme curvature change rates occur
half way between each pair of transition dates, the slopes at which may be used to
characterize the average green-up and brown-down rates. Besides, a further effort
was made to refine brown-down date estimation, which is usually more uncertain
given the foliage coloration processes (Zhang and Goldberg 2011).
The LSP metrics extraction algorithm of Zhang et al. (2003) is used in MODIS
Land Cover Dynamics products (MCD12Q2). An alternative curve smoothing and
SOS derivation approach akin to that of Zhang et al. (2003) was developed using an
asymmetric Gaussian model (Jönsson and Eklundh 2004; Gao et al. 2008; Tan et al.
2008; 2010). Jönsson and Eklundh (2004) developed an open source LSP extraction
software (TIMESAT), which includes both the double logistic and asymmetric
Gaussian algorithms. Gao et al. (2008) employed the asymmetric Gaussian method
for smoothing MODIS LAI time series. Tan et al. (2008) and Tan et al. (2010)
developed a modified TIMESAT method for generating MODIS LSP for the North
American Carbon Program (NACP). This enhanced TIMESAT approach utilizes
asymmetric Gaussian curve fitting and the third derivative of a fitted curve to
determine key phenological dates. Both double logistic and asymmetric Gaussian
methods utilize semilocal curve geometry to characterize LSP time series and extract
transition dates. The two curve fitting approaches were found to generate similar
results with the exception that the asymmetric Gaussian method is less sensitive to an
incomplete time series with many data gaps (Beck et al. 2006; Gao et al. 2008).
Fig. 4.2 A schematic showing how transition dates are calculated using minimum and maximum
values in the rate of change in curvature. The solid line is an idealized time series of VI data, and
the dashed line is the rate of change in curvature from the VI data. The circles indicate transition
dates. The extreme values located between circles indicate the points at which the curvature
changes sign. The figure is reprinted from Zhang et al. (2003) with permission from Elsevier
108
J. M. Hanes et al.