

points were used. In order to remove contaminations from clouds and the atmosphere, a best index slope extraction (BISE) method was employed. The essence of
the BISE approach is to extract the phenological development curve from NDVI
raw data points based on the assumptions that vegetation growth is consistent (free
from erratic changes) and cloud effects depress the NDVI as reflected by aberrantly low values. A continuous NDVI curve is then extracted from the unswerving
boundary of the annual data point distribution (see White et al. 1997 for details).
An NDVI ratio [(NDVI–NDVI min )/(NDVI max –NDVI min )] was computed for each
pixel, and a constant ratio value of 0.5 was used to mark the SOS. White et al.
(1999, 2002) further simplified this approach to the seasonal midpoint NDVI
(SMN) method, which computes the midpoint between minimum and maximum
NDVI values for each pixel as the threshold (maximum composite data were used
in these follow-up studies). Thus, the determined SOS is proportional to sitespecific NDVI amplitude and is therefore sensitive to spatial and temporal phenological variations.
Among the algorithms used for phenological signal extraction from annual VI
profiles, a method using the growth curve (modeled with a logistic function) bears
a closer resemblance to actual springtime vegetation development (Fischer 1994;
Zhang et al. 2003). The logistic function is a common type of sigmoid model that
approximates an s-shaped curve, which is used to simulate a natural process with
an initial stage of exponential growth, followed with a tapering growth rate as
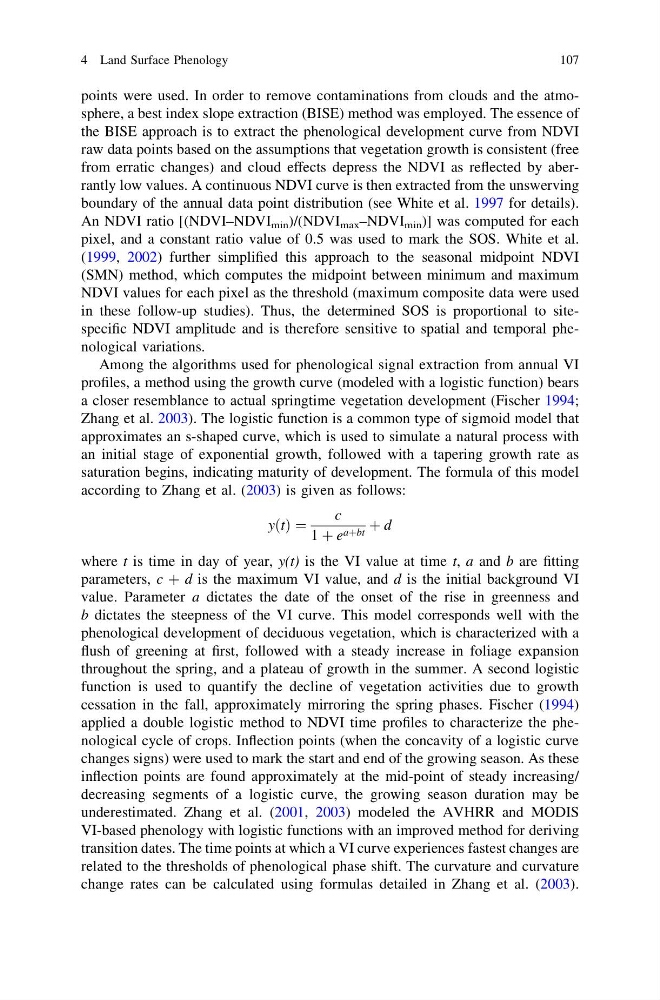
saturation begins, indicating maturity of development. The formula of this model
according to Zhang et al. (2003) is given as follows:
y t
ð Þ ¼
c
1 þ e aþbt þ d
where t is time in day of year, y(t) is the VI value at time t, a and b are fitting
parameters, c ? d is the maximum VI value, and d is the initial background VI
value. Parameter a dictates the date of the onset of the rise in greenness and
b dictates the steepness of the VI curve. This model corresponds well with the
phenological development of deciduous vegetation, which is characterized with a
flush of greening at first, followed with a steady increase in foliage expansion
throughout the spring, and a plateau of growth in the summer. A second logistic
function is used to quantify the decline of vegetation activities due to growth
cessation in the fall, approximately mirroring the spring phases. Fischer (1994)
applied a double logistic method to NDVI time profiles to characterize the phenological cycle of crops. Inflection points (when the concavity of a logistic curve
changes signs) were used to mark the start and end of the growing season. As these
inflection points are found approximately at the mid-point of steady increasing/
decreasing segments of a logistic curve, the growing season duration may be
underestimated. Zhang et al. (2001, 2003) modeled the AVHRR and MODIS
VI-based phenology with logistic functions with an improved method for deriving
transition dates. The time points at which a VI curve experiences fastest changes are
related to the thresholds of phenological phase shift. The curvature and curvature
change rates can be calculated using formulas detailed in Zhang et al. (2003).
4 Land Surface Phenology
107
the BISE approach is to extract the phenological development curve from NDVI
raw data points based on the assumptions that vegetation growth is consistent (free
from erratic changes) and cloud effects depress the NDVI as reflected by aberrantly low values. A continuous NDVI curve is then extracted from the unswerving
boundary of the annual data point distribution (see White et al. 1997 for details).
An NDVI ratio [(NDVI–NDVI min )/(NDVI max –NDVI min )] was computed for each
pixel, and a constant ratio value of 0.5 was used to mark the SOS. White et al.
(1999, 2002) further simplified this approach to the seasonal midpoint NDVI
(SMN) method, which computes the midpoint between minimum and maximum
NDVI values for each pixel as the threshold (maximum composite data were used
in these follow-up studies). Thus, the determined SOS is proportional to sitespecific NDVI amplitude and is therefore sensitive to spatial and temporal phenological variations.
Among the algorithms used for phenological signal extraction from annual VI
profiles, a method using the growth curve (modeled with a logistic function) bears
a closer resemblance to actual springtime vegetation development (Fischer 1994;
Zhang et al. 2003). The logistic function is a common type of sigmoid model that
approximates an s-shaped curve, which is used to simulate a natural process with
an initial stage of exponential growth, followed with a tapering growth rate as
saturation begins, indicating maturity of development. The formula of this model
according to Zhang et al. (2003) is given as follows:
y t
ð Þ ¼
c
1 þ e aþbt þ d
where t is time in day of year, y(t) is the VI value at time t, a and b are fitting
parameters, c ? d is the maximum VI value, and d is the initial background VI
value. Parameter a dictates the date of the onset of the rise in greenness and
b dictates the steepness of the VI curve. This model corresponds well with the
phenological development of deciduous vegetation, which is characterized with a
flush of greening at first, followed with a steady increase in foliage expansion
throughout the spring, and a plateau of growth in the summer. A second logistic
function is used to quantify the decline of vegetation activities due to growth
cessation in the fall, approximately mirroring the spring phases. Fischer (1994)
applied a double logistic method to NDVI time profiles to characterize the phenological cycle of crops. Inflection points (when the concavity of a logistic curve
changes signs) were used to mark the start and end of the growing season. As these
inflection points are found approximately at the mid-point of steady increasing/
decreasing segments of a logistic curve, the growing season duration may be
underestimated. Zhang et al. (2001, 2003) modeled the AVHRR and MODIS
VI-based phenology with logistic functions with an improved method for deriving
transition dates. The time points at which a VI curve experiences fastest changes are
related to the thresholds of phenological phase shift. The curvature and curvature
change rates can be calculated using formulas detailed in Zhang et al. (2003).
4 Land Surface Phenology
107