

So far as x þ y þ z ¼ 1, two chromaticity coordinates adequately represent
color in a chromaticity diagram and the chromaticities can be displayed as 2-D
plots of either y (green) – z (blue) or x (red) – y (green).
Using the CIE color values, x’(l), y’(l), z’(l) and assuming monochromatic light
of a given wavelength as the spectrum E(l), the CIE chromaticity coordinates may
be obtained for that particular wavelength. By repeating this procedure, the CIE
chromaticity coordinates may be obtained for each wavelength throughout the
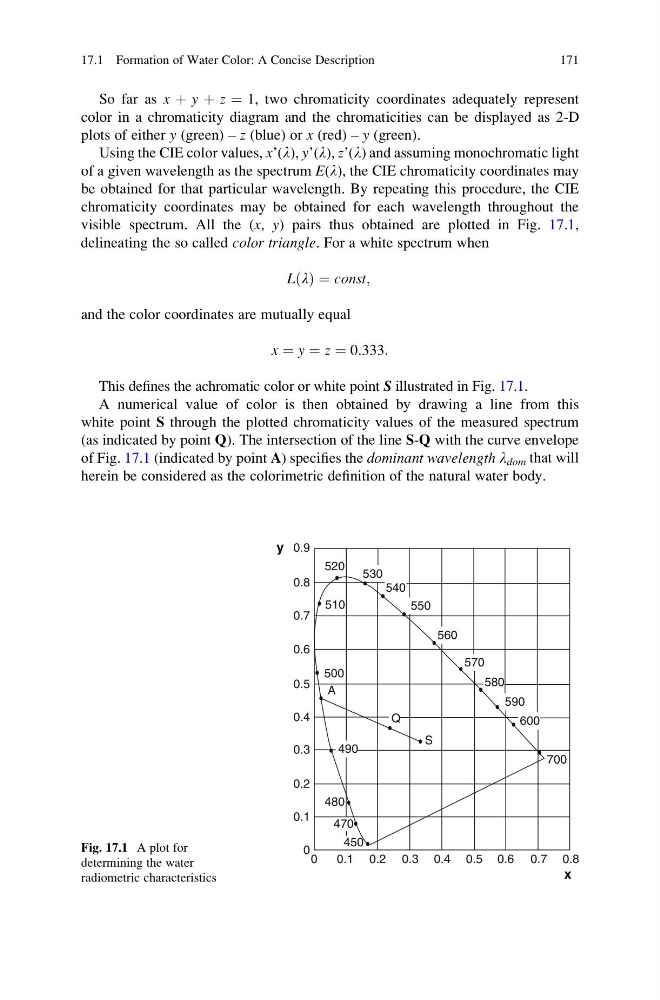
visible spectrum. All the (x, y) pairs thus obtained are plotted in Fig. 17.1,
delineating the so called color triangle. For a white spectrum when
LðlÞ ¼ const;
and the color coordinates are mutually equal
x ¼ y ¼ z ¼ 0:333:
This defines the achromatic color or white point S illustrated in Fig. 17.1.
A numerical value of color is then obtained by drawing a line from this
white point S through the plotted chromaticity values of the measured spectrum
(as indicated by point Q). The intersection of the line S-Q with the curve envelope
of Fig. 17.1 (indicated by point A) specifies the dominant wavelength l dom that will
herein be considered as the colorimetric definition of the natural water body.
530
520
510
500
490
480
470
450
540
550
560
570
580
590
600
700
0.9
0.8
0.7
0.6
0.6 0.7 0.8
0.5
0.5
0.4
0.4
0.3
0.3
0.2
0.1
0.2
0.1
0
0
y
x
A
Q
S
Fig. 17.1 A plot for
determining the water
radiometric characteristics
17.1 Formation of Water Color: A Concise Description
171
color in a chromaticity diagram and the chromaticities can be displayed as 2-D
plots of either y (green) – z (blue) or x (red) – y (green).
Using the CIE color values, x’(l), y’(l), z’(l) and assuming monochromatic light
of a given wavelength as the spectrum E(l), the CIE chromaticity coordinates may
be obtained for that particular wavelength. By repeating this procedure, the CIE
chromaticity coordinates may be obtained for each wavelength throughout the
visible spectrum. All the (x, y) pairs thus obtained are plotted in Fig. 17.1,
delineating the so called color triangle. For a white spectrum when
LðlÞ ¼ const;
and the color coordinates are mutually equal
x ¼ y ¼ z ¼ 0:333:
This defines the achromatic color or white point S illustrated in Fig. 17.1.
A numerical value of color is then obtained by drawing a line from this
white point S through the plotted chromaticity values of the measured spectrum
(as indicated by point Q). The intersection of the line S-Q with the curve envelope
of Fig. 17.1 (indicated by point A) specifies the dominant wavelength l dom that will
herein be considered as the colorimetric definition of the natural water body.
530
520
510
500
490
480
470
450
540
550
560
570
580
590
600
700
0.9
0.8
0.7
0.6
0.6 0.7 0.8
0.5
0.5
0.4
0.4
0.3
0.3
0.2
0.1
0.2
0.1
0
0
y
x
A
Q
S
Fig. 17.1 A plot for
determining the water
radiometric characteristics
17.1 Formation of Water Color: A Concise Description
171