

Let the temperature profile be obtained at North-West of Russia. Then the data
base of aerologic sounding at the Main Geophysical Observatory in Voeykovo, St.
Petersburg suburb that regularly widened for many years, provides calculating
values of the temperature at different altitudes averaged over many years in
corresponding season and constructing the temperature correlation matrix K TT .
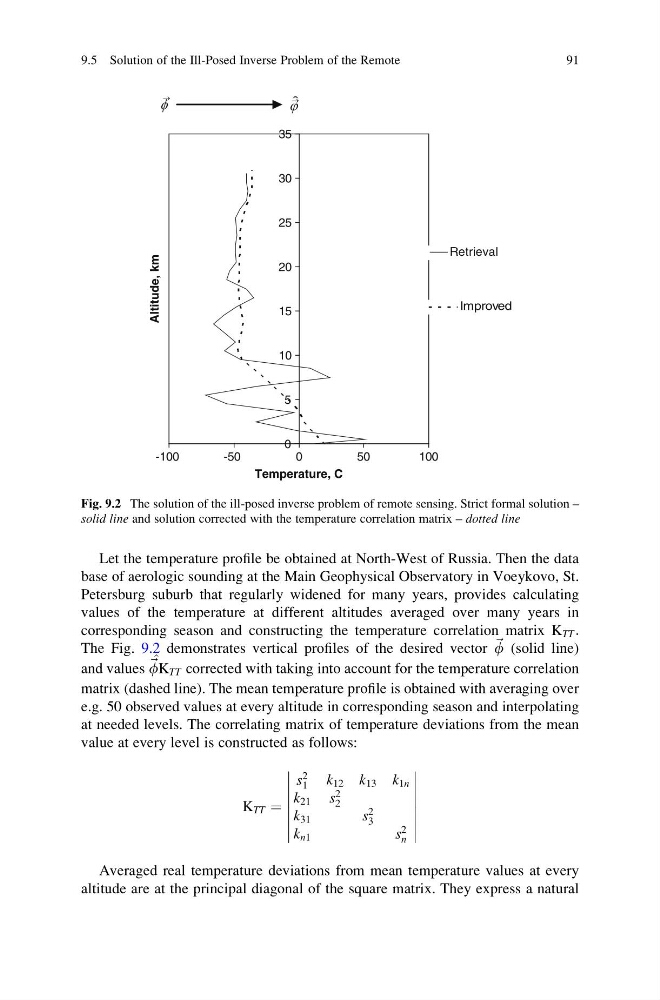
The Fig. 9.2 demonstrates vertical profiles of the desired vector ~ f (solid line)
and values
^
~ fK TT corrected with taking into account for the temperature correlation
matrix (dashed line). The mean temperature profile is obtained with averaging over
e.g. 50 observed values at every altitude in corresponding season and interpolating
at needed levels. The correlating matrix of temperature deviations from the mean
value at every level is constructed as follows:
K TT ¼
s
2
1
k 12 k 13 k 1n
k 21 s
2
2
k 31
s
2
3
k n1
s
2
n
Averaged real temperature deviations from mean temperature values at every
altitude are at the principal diagonal of the square matrix. They express a natural
f
j
0
5
10
15
20
25
30
35
-100
-50
0
50
100
Temperature, C
Altitude, km
Retrieval
Improved
→
→
Fig. 9.2 The solution of the ill-posed inverse problem of remote sensing. Strict formal solution –
solid line and solution corrected with the temperature correlation matrix – dotted line
9.5 Solution of the Ill-Posed Inverse Problem of the Remote
91
base of aerologic sounding at the Main Geophysical Observatory in Voeykovo, St.
Petersburg suburb that regularly widened for many years, provides calculating
values of the temperature at different altitudes averaged over many years in
corresponding season and constructing the temperature correlation matrix K TT .
The Fig. 9.2 demonstrates vertical profiles of the desired vector ~ f (solid line)
and values
^
~ fK TT corrected with taking into account for the temperature correlation
matrix (dashed line). The mean temperature profile is obtained with averaging over
e.g. 50 observed values at every altitude in corresponding season and interpolating
at needed levels. The correlating matrix of temperature deviations from the mean
value at every level is constructed as follows:
K TT ¼
s
2
1
k 12 k 13 k 1n
k 21 s
2
2
k 31
s
2
3
k n1
s
2
n
Averaged real temperature deviations from mean temperature values at every
altitude are at the principal diagonal of the square matrix. They express a natural
f
j
0
5
10
15
20
25
30
35
-100
-50
0
50
100
Temperature, C
Altitude, km
Retrieval
Improved
→
→
Fig. 9.2 The solution of the ill-posed inverse problem of remote sensing. Strict formal solution –
solid line and solution corrected with the temperature correlation matrix – dotted line
9.5 Solution of the Ill-Posed Inverse Problem of the Remote
91