

2.5 Conclusions and Future Directions
Aerial photography provides a unique tool for coral reef management applications.
Its on-demand nature allows managers to plan data collection during optimum
solar conditions, or during or following specific events (e.g., storms, bleaching,
etc.), and the low relative cost for high spatial resolution images is within range of
many project budgets. While case-specific, other high-resolution data acquisitions
may cost anywhere from two to three times as much depending on the sensor or
logistical issues (Mumby et al. 1999, 2000). The case studies presented in this
chapter represent the broad range of uses of aerial photography in coral reef
management, from spatial mapping to establish baseline conditions or monitor
change and track changes over time, to using spectral information inherent in
digital images to measure water conditions or other environmental parameters.
As technology advances in the collection and computer analysis of aerial
photography, more and more studies are acquiring images digitally, thus eliminating the work of developing and scanning hard-copy photographs. Many studies
that historically used film-based aerial photography as a research analysis tool are
now using advanced digital techniques, as well as transitioning to multispectral
and hyperspectral images as these types of remotely sensed images become more
readily available and within budget (for more details, see Chaps. 3 and 4). Using
GIS software and combining digital aerial images with other remotely sensed or
field-collected data layers gives scientists and coral reef managers one more tool to
assist with decision-making.
Acknowledgments This contribution was supported by the U.S. Geological Survey’s Geologic
Processes on Pacific Coral Reefs Project. Pat Chavez and Rian Bogle (USGS Flagstaff, AZ)
collected the digital photographs and natural-color video for the Moloka‘i sediment study.
Sediment
Mass
Bathymetry
Water
Volume
SSC
1.125 L
0 L
27,684.8 mg
0 mg
123,044.5 mg/L
5.2 mg/L
0 m
-18 m
a
b
c
d
0
Kilometers
3
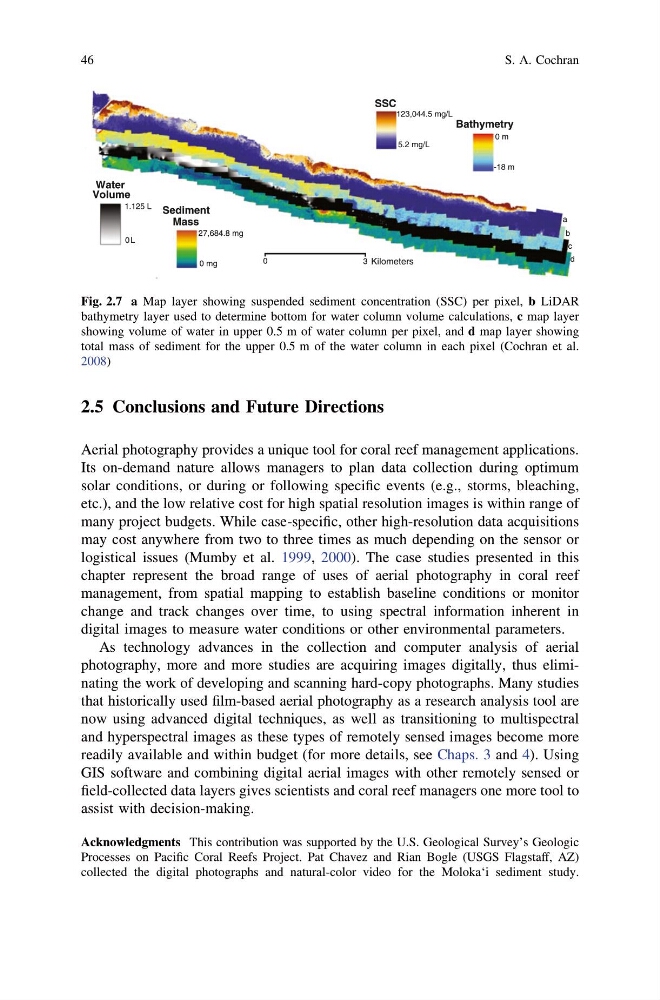
Fig. 2.7 a Map layer showing suspended sediment concentration (SSC) per pixel, b LiDAR
bathymetry layer used to determine bottom for water column volume calculations, c map layer
showing volume of water in upper 0.5 m of water column per pixel, and d map layer showing
total mass of sediment for the upper 0.5 m of the water column in each pixel (Cochran et al.
2008)
46
S. A. Cochran
Aerial photography provides a unique tool for coral reef management applications.
Its on-demand nature allows managers to plan data collection during optimum
solar conditions, or during or following specific events (e.g., storms, bleaching,
etc.), and the low relative cost for high spatial resolution images is within range of
many project budgets. While case-specific, other high-resolution data acquisitions
may cost anywhere from two to three times as much depending on the sensor or
logistical issues (Mumby et al. 1999, 2000). The case studies presented in this
chapter represent the broad range of uses of aerial photography in coral reef
management, from spatial mapping to establish baseline conditions or monitor
change and track changes over time, to using spectral information inherent in
digital images to measure water conditions or other environmental parameters.
As technology advances in the collection and computer analysis of aerial
photography, more and more studies are acquiring images digitally, thus eliminating the work of developing and scanning hard-copy photographs. Many studies
that historically used film-based aerial photography as a research analysis tool are
now using advanced digital techniques, as well as transitioning to multispectral
and hyperspectral images as these types of remotely sensed images become more
readily available and within budget (for more details, see Chaps. 3 and 4). Using
GIS software and combining digital aerial images with other remotely sensed or
field-collected data layers gives scientists and coral reef managers one more tool to
assist with decision-making.
Acknowledgments This contribution was supported by the U.S. Geological Survey’s Geologic
Processes on Pacific Coral Reefs Project. Pat Chavez and Rian Bogle (USGS Flagstaff, AZ)
collected the digital photographs and natural-color video for the Moloka‘i sediment study.
Sediment
Mass
Bathymetry
Water
Volume
SSC
1.125 L
0 L
27,684.8 mg
0 mg
123,044.5 mg/L
5.2 mg/L
0 m
-18 m
a
b
c
d
0
Kilometers
3
Fig. 2.7 a Map layer showing suspended sediment concentration (SSC) per pixel, b LiDAR
bathymetry layer used to determine bottom for water column volume calculations, c map layer
showing volume of water in upper 0.5 m of water column per pixel, and d map layer showing
total mass of sediment for the upper 0.5 m of the water column in each pixel (Cochran et al.
2008)
46
S. A. Cochran