

bathymetric data. At approximately 15–20 m depth, it becomes difficult to
discriminate coral features in the aerial photographs. The LiDAR bathymetry,
however, extends to nearly 40 m depth. The combination of spectral information
from the aerial photography and shaded relief created from the bathymetric data
extends the depth at which underwater features can be ‘‘seen’’ and assists with
interpretation and analysis (Cochran et al. 2007). The three-dimensional detail
provided by the LiDAR data allows easy discrimination of topographic features,
such as smaller patch reefs, pits, and channels. It also allows for calculations of
rugosity, or topographic variability, an important factor for habitat complexity
(Brock et al. 2004). Additional applications of the use of LiDAR data to map and
quantify coral habitats are presented in Chaps. 5–7.
Recent advances have been made in computer software to classify images using
multi-scale object-oriented (pattern or texture) recognition rather than using
spectral data alone. Object-based image analysis (OBIA) uses a two-step process
where the objects in an image are first defined, or segmented, using vectors rather
than raster pixels. The objects are then used as training blocks in a classification
Depth Range of reef flat
0.0 - 0.5 m
1.0 - 2.0 m
True-color (RGB) image
False-color (CIR) image
a 1
a 2
b 1
b 2
0
100 m
0
100 m
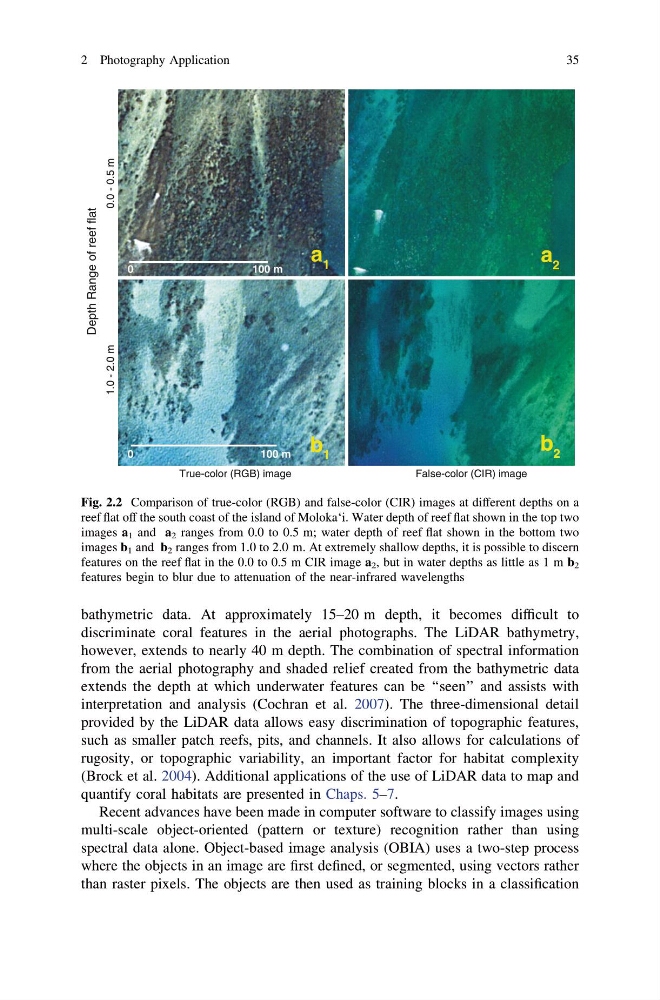
Fig. 2.2 Comparison of true-color (RGB) and false-color (CIR) images at different depths on a
reef flat off the south coast of the island of Moloka‘i. Water depth of reef flat shown in the top two
images a 1 and a 2 ranges from 0.0 to 0.5 m; water depth of reef flat shown in the bottom two
images b 1 and b 2 ranges from 1.0 to 2.0 m. At extremely shallow depths, it is possible to discern
features on the reef flat in the 0.0 to 0.5 m CIR image a 2 , but in water depths as little as 1 m b 2
features begin to blur due to attenuation of the near-infrared wavelengths
2 Photography Application
35
discriminate coral features in the aerial photographs. The LiDAR bathymetry,
however, extends to nearly 40 m depth. The combination of spectral information
from the aerial photography and shaded relief created from the bathymetric data
extends the depth at which underwater features can be ‘‘seen’’ and assists with
interpretation and analysis (Cochran et al. 2007). The three-dimensional detail
provided by the LiDAR data allows easy discrimination of topographic features,
such as smaller patch reefs, pits, and channels. It also allows for calculations of
rugosity, or topographic variability, an important factor for habitat complexity
(Brock et al. 2004). Additional applications of the use of LiDAR data to map and
quantify coral habitats are presented in Chaps. 5–7.
Recent advances have been made in computer software to classify images using
multi-scale object-oriented (pattern or texture) recognition rather than using
spectral data alone. Object-based image analysis (OBIA) uses a two-step process
where the objects in an image are first defined, or segmented, using vectors rather
than raster pixels. The objects are then used as training blocks in a classification
Depth Range of reef flat
0.0 - 0.5 m
1.0 - 2.0 m
True-color (RGB) image
False-color (CIR) image
a 1
a 2
b 1
b 2
0
100 m
0
100 m
Fig. 2.2 Comparison of true-color (RGB) and false-color (CIR) images at different depths on a
reef flat off the south coast of the island of Moloka‘i. Water depth of reef flat shown in the top two
images a 1 and a 2 ranges from 0.0 to 0.5 m; water depth of reef flat shown in the bottom two
images b 1 and b 2 ranges from 1.0 to 2.0 m. At extremely shallow depths, it is possible to discern
features on the reef flat in the 0.0 to 0.5 m CIR image a 2 , but in water depths as little as 1 m b 2
features begin to blur due to attenuation of the near-infrared wavelengths
2 Photography Application
35