

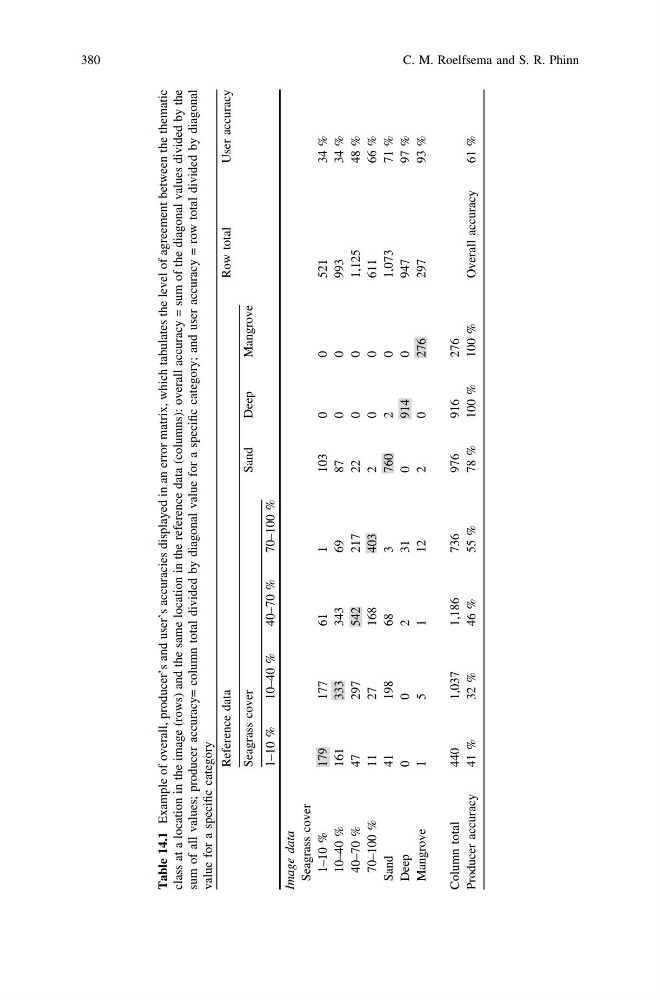
Table 14.1
Example of overall, producer’s and user’s accuracies displayed in an error matrix, which tabulates the level of agreement between the thematic
class at a location in the image (rows) and the same location in the reference data (columns): overall accuracy = sum of the diagonal values divided by the
sum of all values; producer accuracy= column total divided by diagonal value for a specific category; and user accuracy = row total divided by diagonal
value for a specific category
Reference data
Row total
User accuracy
Seagrass cover
Sand
Deep
Mangrove
1–10 %
10–40 %
40–70 %
70–100 %
Image data
Seagrass cover
1–10 %
179
177
61
1
103
0
0
521
34 %
10–40 %
161
333
343
69
87
0
0
993
34 %
40–70 %
47
297
542
217
22
0
0
1,125
48 %
70–100 %
11
27
168
403
2
0
0
611
66 %
Sand
41
198
68
3
760
2
0
1,073
71 %
Deep
0
0
2
31
0
914
0
947
97 %
Mangrove
1
5
1
12
2
0
276
297
93 %
Column total
440
1,037
1,186
736
976
916
276
Producer accuracy
41 %
32 %
46 %
55 %
78 %
100 %
100 %
Overall accuracy
61 %
380
C. M. Roelfsema and S. R. Phinn
Example of overall, producer’s and user’s accuracies displayed in an error matrix, which tabulates the level of agreement between the thematic
class at a location in the image (rows) and the same location in the reference data (columns): overall accuracy = sum of the diagonal values divided by the
sum of all values; producer accuracy= column total divided by diagonal value for a specific category; and user accuracy = row total divided by diagonal
value for a specific category
Reference data
Row total
User accuracy
Seagrass cover
Sand
Deep
Mangrove
1–10 %
10–40 %
40–70 %
70–100 %
Image data
Seagrass cover
1–10 %
179
177
61
1
103
0
0
521
34 %
10–40 %
161
333
343
69
87
0
0
993
34 %
40–70 %
47
297
542
217
22
0
0
1,125
48 %
70–100 %
11
27
168
403
2
0
0
611
66 %
Sand
41
198
68
3
760
2
0
1,073
71 %
Deep
0
0
2
31
0
914
0
947
97 %
Mangrove
1
5
1
12
2
0
276
297
93 %
Column total
440
1,037
1,186
736
976
916
276
Producer accuracy
41 %
32 %
46 %
55 %
78 %
100 %
100 %
Overall accuracy
61 %
380
C. M. Roelfsema and S. R. Phinn