

Ocean features Ocean features analyzed from SAR imagery may provide clues
to physical oceanographic processes that can impact coral reefs (i.e., currents,
eddies, turbulent mixing, and convergent processes). Information can be obtained
on whether upwelling and mixing of colder water will ameliorate potential or
actual coral bleaching, provide extra nutrients to the coral reef ecosystem, or lead
to thermal stress. Figure 13.11 illustrates an ocean feature, in this case internal
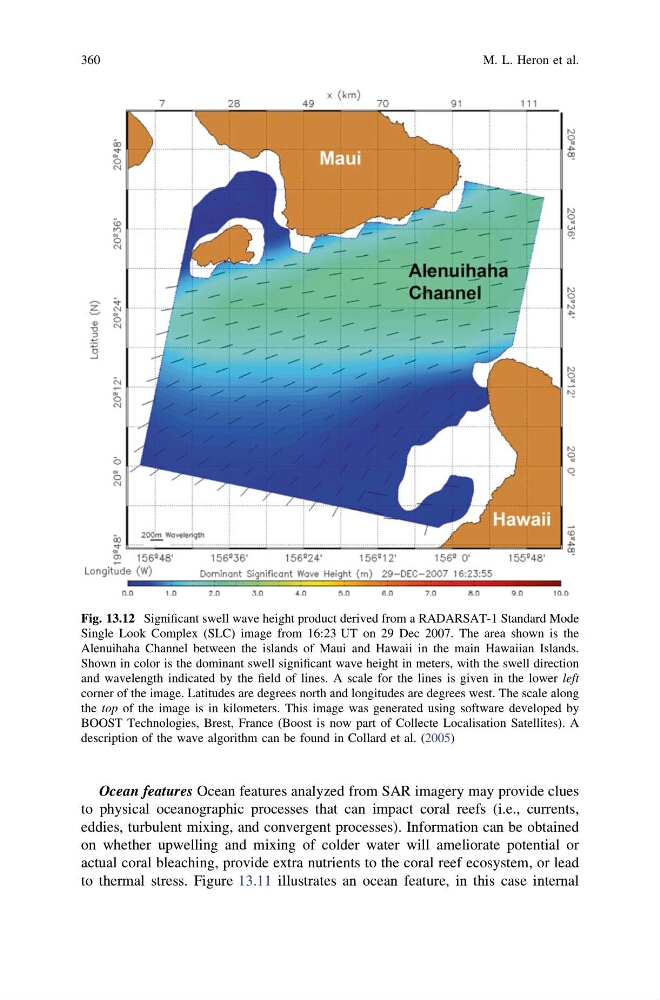
Fig. 13.12 Significant swell wave height product derived from a RADARSAT-1 Standard Mode
Single Look Complex (SLC) image from 16:23 UT on 29 Dec 2007. The area shown is the
Alenuihaha Channel between the islands of Maui and Hawaii in the main Hawaiian Islands.
Shown in color is the dominant swell significant wave height in meters, with the swell direction
and wavelength indicated by the field of lines. A scale for the lines is given in the lower left
corner of the image. Latitudes are degrees north and longitudes are degrees west. The scale along
the top of the image is in kilometers. This image was generated using software developed by
BOOST Technologies, Brest, France (Boost is now part of Collecte Localisation Satellites). A
description of the wave algorithm can be found in Collard et al. (2005)
360
M. L. Heron et al.
to physical oceanographic processes that can impact coral reefs (i.e., currents,
eddies, turbulent mixing, and convergent processes). Information can be obtained
on whether upwelling and mixing of colder water will ameliorate potential or
actual coral bleaching, provide extra nutrients to the coral reef ecosystem, or lead
to thermal stress. Figure 13.11 illustrates an ocean feature, in this case internal
Fig. 13.12 Significant swell wave height product derived from a RADARSAT-1 Standard Mode
Single Look Complex (SLC) image from 16:23 UT on 29 Dec 2007. The area shown is the
Alenuihaha Channel between the islands of Maui and Hawaii in the main Hawaiian Islands.
Shown in color is the dominant swell significant wave height in meters, with the swell direction
and wavelength indicated by the field of lines. A scale for the lines is given in the lower left
corner of the image. Latitudes are degrees north and longitudes are degrees west. The scale along
the top of the image is in kilometers. This image was generated using software developed by
BOOST Technologies, Brest, France (Boost is now part of Collecte Localisation Satellites). A
description of the wave algorithm can be found in Collard et al. (2005)
360
M. L. Heron et al.