

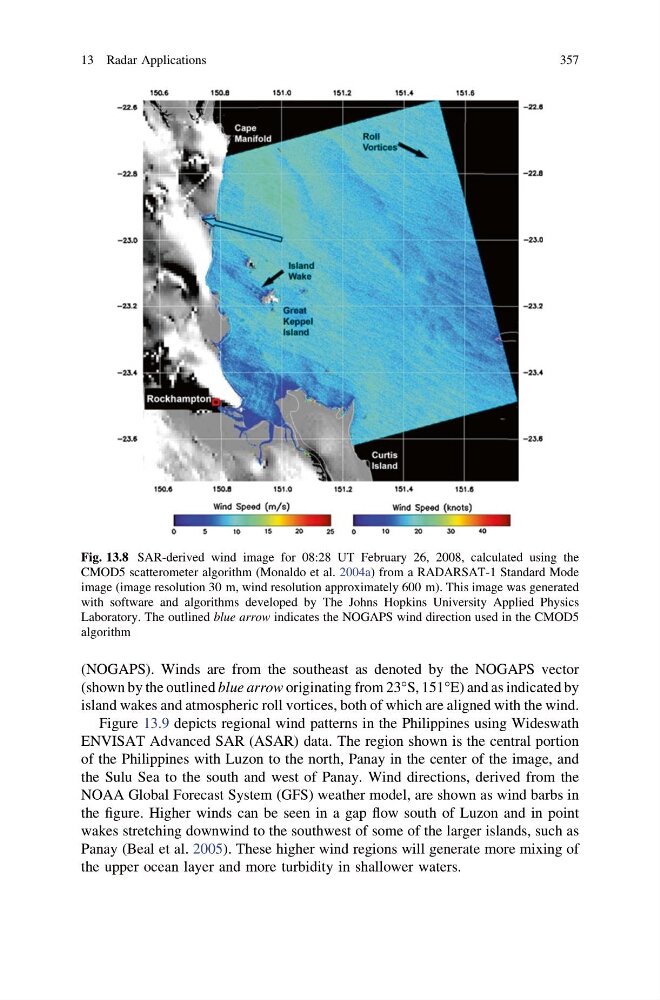
(NOGAPS). Winds are from the southeast as denoted by the NOGAPS vector
(shown by the outlined blue arrow originating from 23°S, 151°E) and as indicated by
island wakes and atmospheric roll vortices, both of which are aligned with the wind.
Figure 13.9 depicts regional wind patterns in the Philippines using Wideswath
ENVISAT Advanced SAR (ASAR) data. The region shown is the central portion
of the Philippines with Luzon to the north, Panay in the center of the image, and
the Sulu Sea to the south and west of Panay. Wind directions, derived from the
NOAA Global Forecast System (GFS) weather model, are shown as wind barbs in
the figure. Higher winds can be seen in a gap flow south of Luzon and in point
wakes stretching downwind to the southwest of some of the larger islands, such as
Panay (Beal et al. 2005). These higher wind regions will generate more mixing of
the upper ocean layer and more turbidity in shallower waters.
Fig. 13.8 SAR-derived wind image for 08:28 UT February 26, 2008, calculated using the
CMOD5 scatterometer algorithm (Monaldo et al. 2004a) from a RADARSAT-1 Standard Mode
image (image resolution 30 m, wind resolution approximately 600 m). This image was generated
with software and algorithms developed by The Johns Hopkins University Applied Physics
Laboratory. The outlined blue arrow indicates the NOGAPS wind direction used in the CMOD5
algorithm
13 Radar Applications
357
(shown by the outlined blue arrow originating from 23°S, 151°E) and as indicated by
island wakes and atmospheric roll vortices, both of which are aligned with the wind.
Figure 13.9 depicts regional wind patterns in the Philippines using Wideswath
ENVISAT Advanced SAR (ASAR) data. The region shown is the central portion
of the Philippines with Luzon to the north, Panay in the center of the image, and
the Sulu Sea to the south and west of Panay. Wind directions, derived from the
NOAA Global Forecast System (GFS) weather model, are shown as wind barbs in
the figure. Higher winds can be seen in a gap flow south of Luzon and in point
wakes stretching downwind to the southwest of some of the larger islands, such as
Panay (Beal et al. 2005). These higher wind regions will generate more mixing of
the upper ocean layer and more turbidity in shallower waters.
Fig. 13.8 SAR-derived wind image for 08:28 UT February 26, 2008, calculated using the
CMOD5 scatterometer algorithm (Monaldo et al. 2004a) from a RADARSAT-1 Standard Mode
image (image resolution 30 m, wind resolution approximately 600 m). This image was generated
with software and algorithms developed by The Johns Hopkins University Applied Physics
Laboratory. The outlined blue arrow indicates the NOGAPS wind direction used in the CMOD5
algorithm
13 Radar Applications
357