

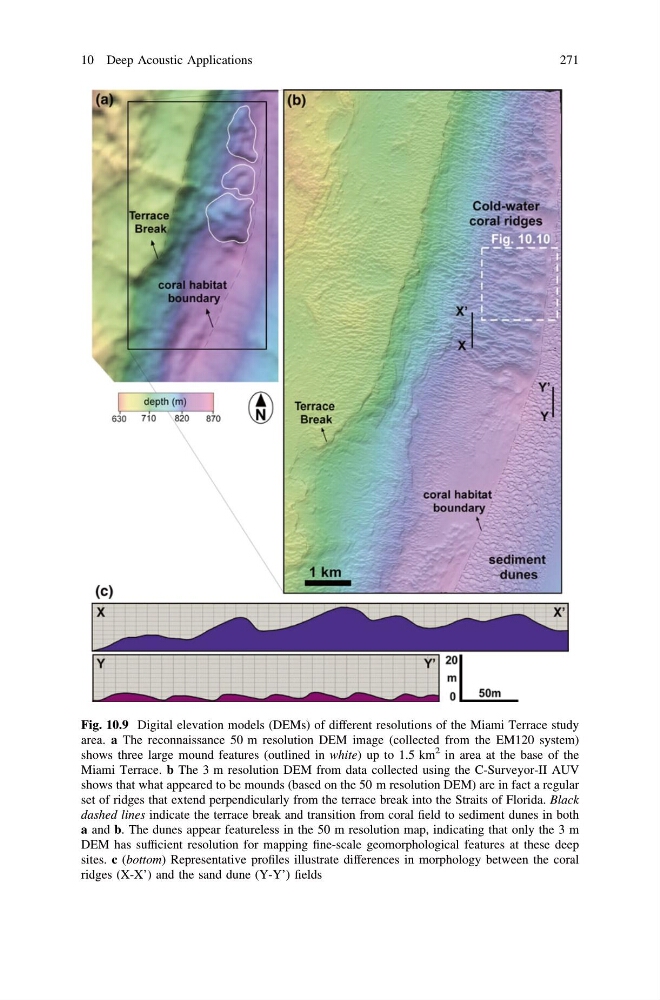
Fig. 10.9 Digital elevation models (DEMs) of different resolutions of the Miami Terrace study
area. a The reconnaissance 50 m resolution DEM image (collected from the EM120 system)
shows three large mound features (outlined in white) up to 1.5 km
2 in area at the base of the
Miami Terrace. b The 3 m resolution DEM from data collected using the C-Surveyor-II AUV
shows that what appeared to be mounds (based on the 50 m resolution DEM) are in fact a regular
set of ridges that extend perpendicularly from the terrace break into the Straits of Florida. Black
dashed lines indicate the terrace break and transition from coral field to sediment dunes in both
a and b. The dunes appear featureless in the 50 m resolution map, indicating that only the 3 m
DEM has sufficient resolution for mapping fine-scale geomorphological features at these deep
sites. c (bottom) Representative profiles illustrate differences in morphology between the coral
ridges (X-X’) and the sand dune (Y-Y’) fields
10 Deep Acoustic Applications
271
area. a The reconnaissance 50 m resolution DEM image (collected from the EM120 system)
shows three large mound features (outlined in white) up to 1.5 km
2 in area at the base of the
Miami Terrace. b The 3 m resolution DEM from data collected using the C-Surveyor-II AUV
shows that what appeared to be mounds (based on the 50 m resolution DEM) are in fact a regular
set of ridges that extend perpendicularly from the terrace break into the Straits of Florida. Black
dashed lines indicate the terrace break and transition from coral field to sediment dunes in both
a and b. The dunes appear featureless in the 50 m resolution map, indicating that only the 3 m
DEM has sufficient resolution for mapping fine-scale geomorphological features at these deep
sites. c (bottom) Representative profiles illustrate differences in morphology between the coral
ridges (X-X’) and the sand dune (Y-Y’) fields
10 Deep Acoustic Applications
271