

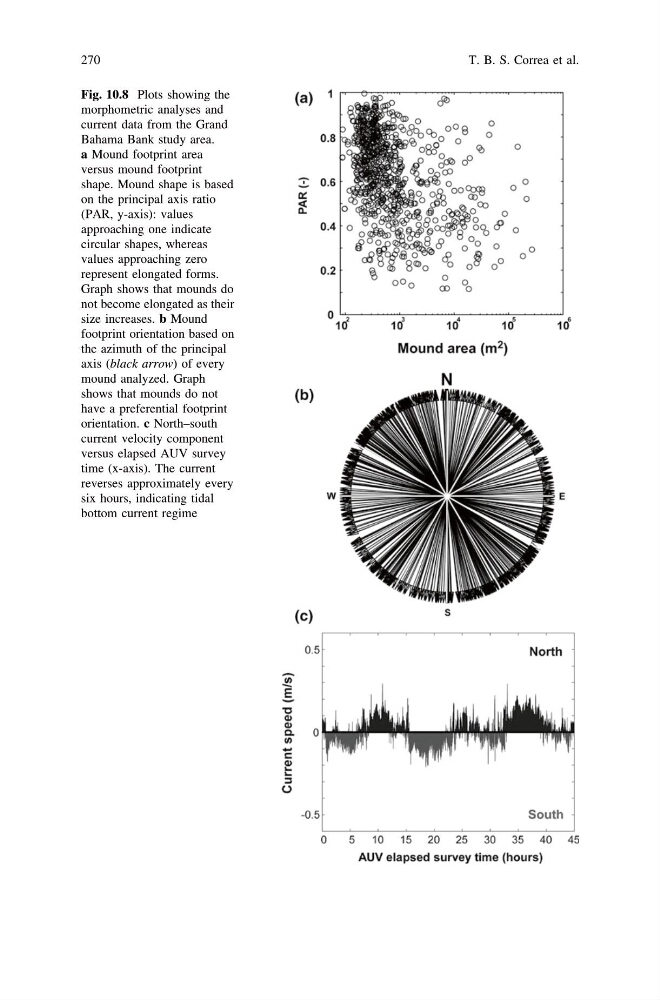
Fig. 10.8 Plots showing the
morphometric analyses and
current data from the Grand
Bahama Bank study area.
a Mound footprint area
versus mound footprint
shape. Mound shape is based
on the principal axis ratio
(PAR, y-axis): values
approaching one indicate
circular shapes, whereas
values approaching zero
represent elongated forms.
Graph shows that mounds do
not become elongated as their
size increases. b Mound
footprint orientation based on
the azimuth of the principal
axis (black arrow) of every
mound analyzed. Graph
shows that mounds do not
have a preferential footprint
orientation. c North–south
current velocity component
versus elapsed AUV survey
time (x-axis). The current
reverses approximately every
six hours, indicating tidal
bottom current regime
270
T. B. S. Correa et al.
morphometric analyses and
current data from the Grand
Bahama Bank study area.
a Mound footprint area
versus mound footprint
shape. Mound shape is based
on the principal axis ratio
(PAR, y-axis): values
approaching one indicate
circular shapes, whereas
values approaching zero
represent elongated forms.
Graph shows that mounds do
not become elongated as their
size increases. b Mound
footprint orientation based on
the azimuth of the principal
axis (black arrow) of every
mound analyzed. Graph
shows that mounds do not
have a preferential footprint
orientation. c North–south
current velocity component
versus elapsed AUV survey
time (x-axis). The current
reverses approximately every
six hours, indicating tidal
bottom current regime
270
T. B. S. Correa et al.