

Table 10.1
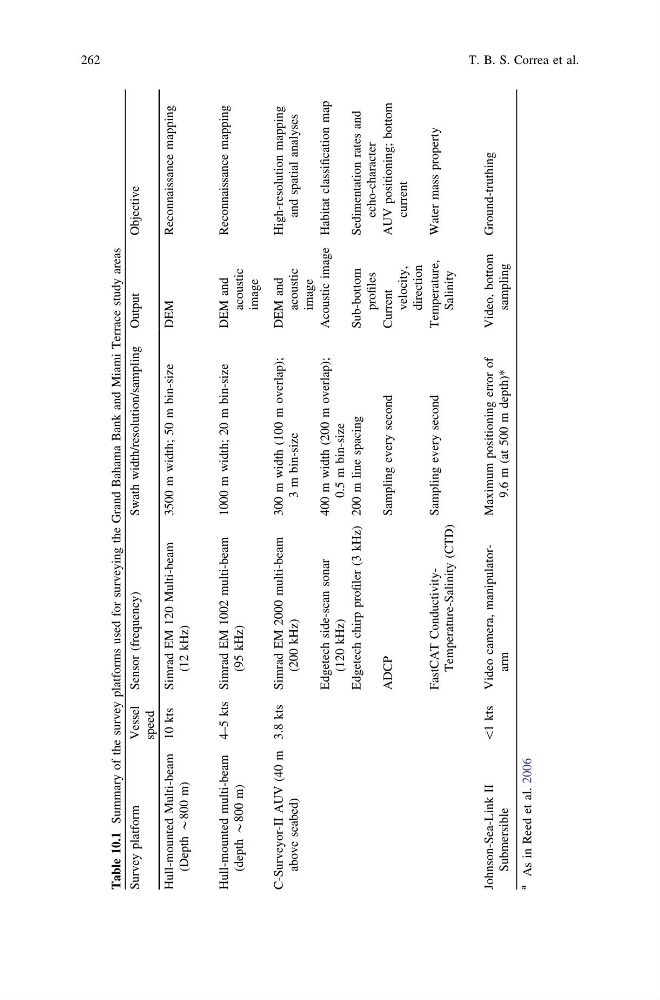
Summary of the survey platforms used for surveying the Grand Bahama Bank and Miami Terrace study areas
Survey platform
Vessel
speed
Sensor (frequency)
Swath width/resolution/sampling Output
Objective
Hull-mounted Multi-beam
(Depth *800
m)
10 kts Simrad EM 120 Multi-beam
(12 kHz)
3500 m width; 50 m bin-size
DEM
Reconnaissance mapping
Hull-mounted multi-beam
(depth *800
m)
4–5 kts Simrad EM 1002 multi-beam
(95 kHz)
1000 m width; 20 m bin-size
DEM and
acoustic
image
Reconnaissance mapping
C-Surveyor-II AUV (40 m
above seabed)
3.8 kts Simrad EM 2000 multi-beam
(200 kHz)
300 m width (100 m overlap);
3 m bin-size
DEM and
acoustic
image
High-resolution mapping
and spatial analyses
Edgetech side-scan sonar
(120 kHz)
400 m width (200 m overlap);
0.5 m bin-size
Acoustic image Habitat classification map
Edgetech chirp profiler (3 kHz) 200 m line spacing
Sub-bottom
profiles
Sedimentation rates and
echo-character
ADCP
Sampling every second
Current
velocity,
direction
AUV positioning; bottom
current
FastCAT ConductivityTemperature-Salinity (CTD)
Sampling every second
Temperature,
Salinity
Water mass property
Johnson-Sea-Link II
Submersible
\1
kts Video camera, manipulatorarm
Maximum positioning error of
9.6 m (at 500 m depth)*
Video, bottom
sampling
Ground-truthing
a
As in Reed et al. 2006
262
T. B. S. Correa et al.
Summary of the survey platforms used for surveying the Grand Bahama Bank and Miami Terrace study areas
Survey platform
Vessel
speed
Sensor (frequency)
Swath width/resolution/sampling Output
Objective
Hull-mounted Multi-beam
(Depth *800
m)
10 kts Simrad EM 120 Multi-beam
(12 kHz)
3500 m width; 50 m bin-size
DEM
Reconnaissance mapping
Hull-mounted multi-beam
(depth *800
m)
4–5 kts Simrad EM 1002 multi-beam
(95 kHz)
1000 m width; 20 m bin-size
DEM and
acoustic
image
Reconnaissance mapping
C-Surveyor-II AUV (40 m
above seabed)
3.8 kts Simrad EM 2000 multi-beam
(200 kHz)
300 m width (100 m overlap);
3 m bin-size
DEM and
acoustic
image
High-resolution mapping
and spatial analyses
Edgetech side-scan sonar
(120 kHz)
400 m width (200 m overlap);
0.5 m bin-size
Acoustic image Habitat classification map
Edgetech chirp profiler (3 kHz) 200 m line spacing
Sub-bottom
profiles
Sedimentation rates and
echo-character
ADCP
Sampling every second
Current
velocity,
direction
AUV positioning; bottom
current
FastCAT ConductivityTemperature-Salinity (CTD)
Sampling every second
Temperature,
Salinity
Water mass property
Johnson-Sea-Link II
Submersible
\1
kts Video camera, manipulatorarm
Maximum positioning error of
9.6 m (at 500 m depth)*
Video, bottom
sampling
Ground-truthing
a
As in Reed et al. 2006
262
T. B. S. Correa et al.