

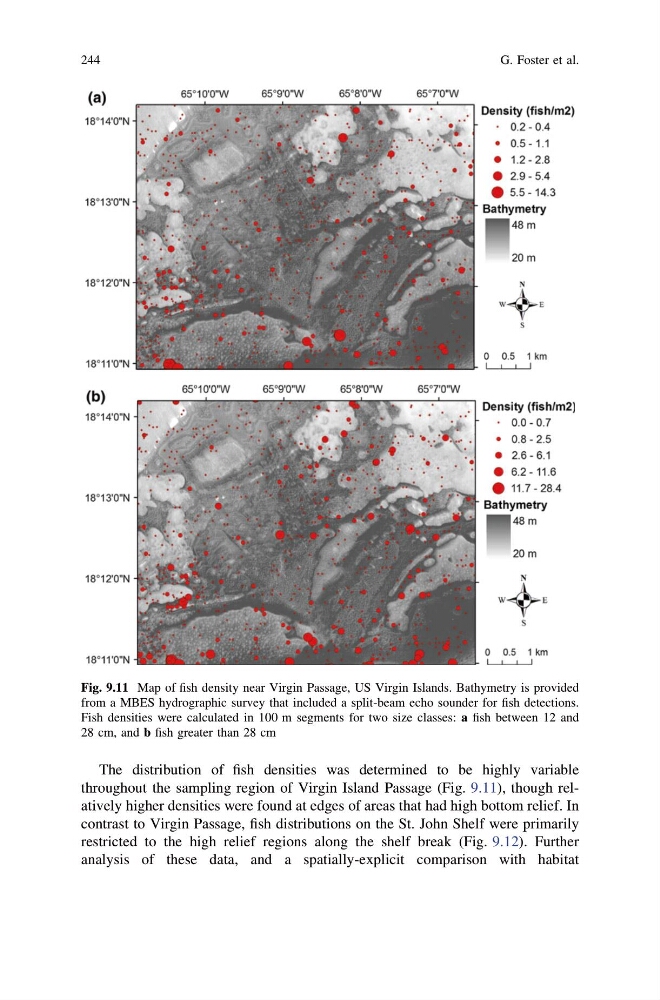
The distribution of fish densities was determined to be highly variable
throughout the sampling region of Virgin Island Passage (Fig. 9.11), though relatively higher densities were found at edges of areas that had high bottom relief. In
contrast to Virgin Passage, fish distributions on the St. John Shelf were primarily
restricted to the high relief regions along the shelf break (Fig. 9.12). Further
analysis of these data, and a spatially-explicit comparison with habitat
Fig. 9.11 Map of fish density near Virgin Passage, US Virgin Islands. Bathymetry is provided
from a MBES hydrographic survey that included a split-beam echo sounder for fish detections.
Fish densities were calculated in 100 m segments for two size classes: a fish between 12 and
28 cm, and b fish greater than 28 cm
244
G. Foster et al.
throughout the sampling region of Virgin Island Passage (Fig. 9.11), though relatively higher densities were found at edges of areas that had high bottom relief. In
contrast to Virgin Passage, fish distributions on the St. John Shelf were primarily
restricted to the high relief regions along the shelf break (Fig. 9.12). Further
analysis of these data, and a spatially-explicit comparison with habitat
Fig. 9.11 Map of fish density near Virgin Passage, US Virgin Islands. Bathymetry is provided
from a MBES hydrographic survey that included a split-beam echo sounder for fish detections.
Fish densities were calculated in 100 m segments for two size classes: a fish between 12 and
28 cm, and b fish greater than 28 cm
244
G. Foster et al.