

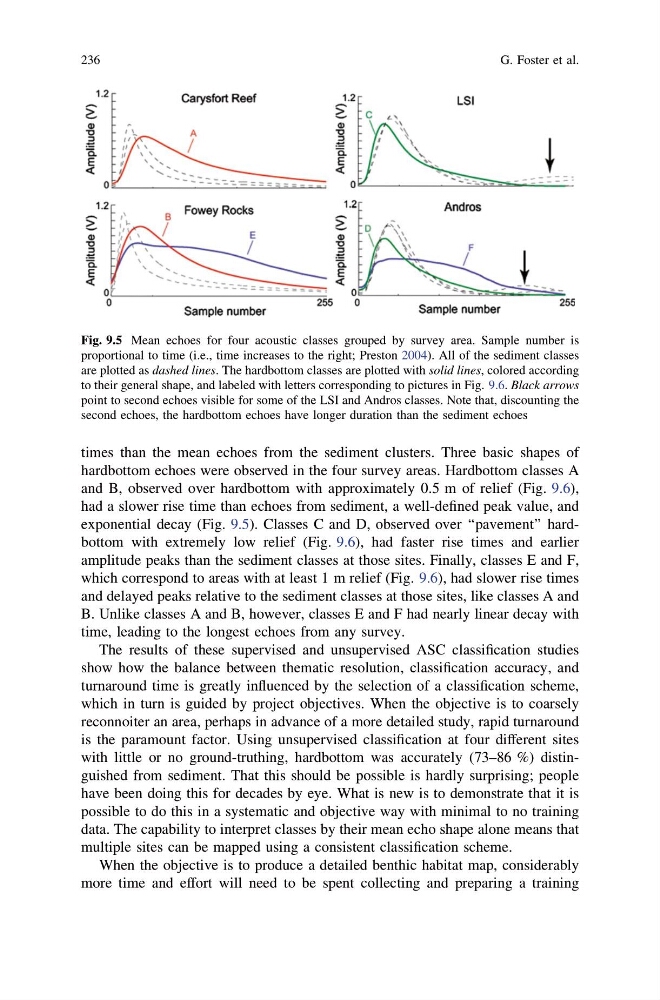
times than the mean echoes from the sediment clusters. Three basic shapes of
hardbottom echoes were observed in the four survey areas. Hardbottom classes A
and B, observed over hardbottom with approximately 0.5 m of relief (Fig. 9.6),
had a slower rise time than echoes from sediment, a well-defined peak value, and
exponential decay (Fig. 9.5). Classes C and D, observed over ‘‘pavement’’ hardbottom with extremely low relief (Fig. 9.6), had faster rise times and earlier
amplitude peaks than the sediment classes at those sites. Finally, classes E and F,
which correspond to areas with at least 1 m relief (Fig. 9.6), had slower rise times
and delayed peaks relative to the sediment classes at those sites, like classes A and
B. Unlike classes A and B, however, classes E and F had nearly linear decay with
time, leading to the longest echoes from any survey.
The results of these supervised and unsupervised ASC classification studies
show how the balance between thematic resolution, classification accuracy, and
turnaround time is greatly influenced by the selection of a classification scheme,
which in turn is guided by project objectives. When the objective is to coarsely
reconnoiter an area, perhaps in advance of a more detailed study, rapid turnaround
is the paramount factor. Using unsupervised classification at four different sites
with little or no ground-truthing, hardbottom was accurately (73–86 %) distinguished from sediment. That this should be possible is hardly surprising; people
have been doing this for decades by eye. What is new is to demonstrate that it is
possible to do this in a systematic and objective way with minimal to no training
data. The capability to interpret classes by their mean echo shape alone means that
multiple sites can be mapped using a consistent classification scheme.
When the objective is to produce a detailed benthic habitat map, considerably
more time and effort will need to be spent collecting and preparing a training
Fig. 9.5 Mean echoes for four acoustic classes grouped by survey area. Sample number is
proportional to time (i.e., time increases to the right; Preston 2004). All of the sediment classes
are plotted as dashed lines. The hardbottom classes are plotted with solid lines, colored according
to their general shape, and labeled with letters corresponding to pictures in Fig. 9.6. Black arrows
point to second echoes visible for some of the LSI and Andros classes. Note that, discounting the
second echoes, the hardbottom echoes have longer duration than the sediment echoes
236
G. Foster et al.
hardbottom echoes were observed in the four survey areas. Hardbottom classes A
and B, observed over hardbottom with approximately 0.5 m of relief (Fig. 9.6),
had a slower rise time than echoes from sediment, a well-defined peak value, and
exponential decay (Fig. 9.5). Classes C and D, observed over ‘‘pavement’’ hardbottom with extremely low relief (Fig. 9.6), had faster rise times and earlier
amplitude peaks than the sediment classes at those sites. Finally, classes E and F,
which correspond to areas with at least 1 m relief (Fig. 9.6), had slower rise times
and delayed peaks relative to the sediment classes at those sites, like classes A and
B. Unlike classes A and B, however, classes E and F had nearly linear decay with
time, leading to the longest echoes from any survey.
The results of these supervised and unsupervised ASC classification studies
show how the balance between thematic resolution, classification accuracy, and
turnaround time is greatly influenced by the selection of a classification scheme,
which in turn is guided by project objectives. When the objective is to coarsely
reconnoiter an area, perhaps in advance of a more detailed study, rapid turnaround
is the paramount factor. Using unsupervised classification at four different sites
with little or no ground-truthing, hardbottom was accurately (73–86 %) distinguished from sediment. That this should be possible is hardly surprising; people
have been doing this for decades by eye. What is new is to demonstrate that it is
possible to do this in a systematic and objective way with minimal to no training
data. The capability to interpret classes by their mean echo shape alone means that
multiple sites can be mapped using a consistent classification scheme.
When the objective is to produce a detailed benthic habitat map, considerably
more time and effort will need to be spent collecting and preparing a training
Fig. 9.5 Mean echoes for four acoustic classes grouped by survey area. Sample number is
proportional to time (i.e., time increases to the right; Preston 2004). All of the sediment classes
are plotted as dashed lines. The hardbottom classes are plotted with solid lines, colored according
to their general shape, and labeled with letters corresponding to pictures in Fig. 9.6. Black arrows
point to second echoes visible for some of the LSI and Andros classes. Note that, discounting the
second echoes, the hardbottom echoes have longer duration than the sediment echoes
236
G. Foster et al.