

6.2.1 Navigational Charting
LiDAR supports navigational charting by acquiring seafloor depths and identifying
possible hazards to navigation. This is particularly important in shallow waters
with hardbottom features, such as coral reefs, to avoid potentially hazardous
groundings and damage to sensitive and valuable coral reef communities.
According to International Hydrographic Organization (IHO) navigational charting standards, LiDAR surveys must not exceed predetermined levels of vertical
and horizontal uncertainties at the 95 % confidence level (IHO 2008). The maximum levels of vertical and horizontal uncertainty allowed depend primarily on the
depth of the surveyed area. In general, shallower areas (\40 m) are subject to more
rigorous standards, where under-keel clearance is critical. Deeper areas ([100 m)
are subject to less rigorous uncertainty standards, where a general description of
the seafloor is adequate. Given the depth dependent nature of these specifications,
bathymetric LiDAR surveys are most often conducted to meet the highest standards of uncertainty (i.e., IHO Special Order or Order 1), since most LiDAR
systems on average only penetrate 30 m into the water column (but in clear water
typical of many reef environments can penetrate as much as 60–70 m).
In 2006, a LiDAR survey of southwestern Puerto Rico was commissioned by
NOAA’s Office of Coast Survey (OCS) to map elevations between 50 m above sea
level downwards to 70 m below sea level. This survey was conducted using the
Laser Airborne Depth Sounder (LADS) Mk II Airborne System (Stephenson and
Sinclair 2006), which uses a 900 Hz Nd: YAG (neodymium-doped yttrium aluminum garnet) laser that is split by an optical coupler into infrared (1,064 nm) and
blue-green (532 nm) beams. The infrared beam measures the height of the plane
above the water surface at nadir, while the green beam oscillates beneath the sortie in
a rectilinear pattern to measure depths and elevations. The data were collected with
4 9 4 m sounding densities and 200 % seabed coverage, which thereby dictated the
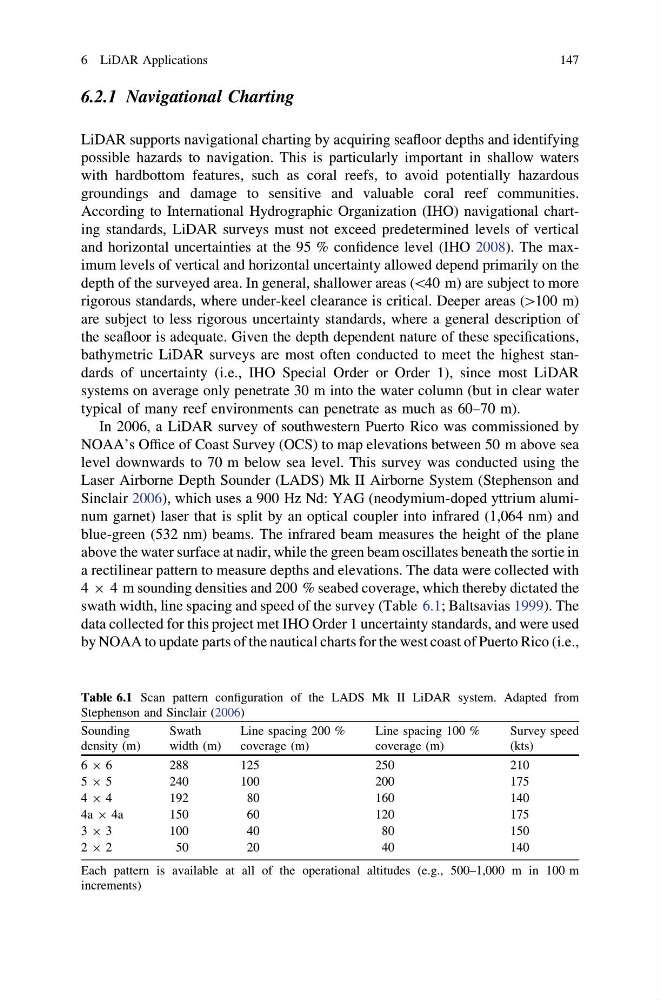
swath width, line spacing and speed of the survey (Table 6.1; Baltsavias 1999). The
data collected for this project met IHO Order 1 uncertainty standards, and were used
by NOAA to update parts of the nautical charts for the west coast of Puerto Rico (i.e.,
Table 6.1 Scan pattern configuration of the LADS Mk II LiDAR system. Adapted from
Stephenson and Sinclair (2006)
Sounding
density (m)
Swath
width (m)
Line spacing 200 %
coverage (m)
Line spacing 100 %
coverage (m)
Survey speed
(kts)
6 9 6
288
125
250
210
5 9 5
240
100
200
175
4 9 4
192
80
160
140
4a 9 4a
150
60
120
175
3 9 3
100
40
80
150
2 9 2
50
20
40
140
Each pattern is available at all of the operational altitudes (e.g., 500–1,000 m in 100 m
increments)
6 LiDAR Applications
147
LiDAR supports navigational charting by acquiring seafloor depths and identifying
possible hazards to navigation. This is particularly important in shallow waters
with hardbottom features, such as coral reefs, to avoid potentially hazardous
groundings and damage to sensitive and valuable coral reef communities.
According to International Hydrographic Organization (IHO) navigational charting standards, LiDAR surveys must not exceed predetermined levels of vertical
and horizontal uncertainties at the 95 % confidence level (IHO 2008). The maximum levels of vertical and horizontal uncertainty allowed depend primarily on the
depth of the surveyed area. In general, shallower areas (\40 m) are subject to more
rigorous standards, where under-keel clearance is critical. Deeper areas ([100 m)
are subject to less rigorous uncertainty standards, where a general description of
the seafloor is adequate. Given the depth dependent nature of these specifications,
bathymetric LiDAR surveys are most often conducted to meet the highest standards of uncertainty (i.e., IHO Special Order or Order 1), since most LiDAR
systems on average only penetrate 30 m into the water column (but in clear water
typical of many reef environments can penetrate as much as 60–70 m).
In 2006, a LiDAR survey of southwestern Puerto Rico was commissioned by
NOAA’s Office of Coast Survey (OCS) to map elevations between 50 m above sea
level downwards to 70 m below sea level. This survey was conducted using the
Laser Airborne Depth Sounder (LADS) Mk II Airborne System (Stephenson and
Sinclair 2006), which uses a 900 Hz Nd: YAG (neodymium-doped yttrium aluminum garnet) laser that is split by an optical coupler into infrared (1,064 nm) and
blue-green (532 nm) beams. The infrared beam measures the height of the plane
above the water surface at nadir, while the green beam oscillates beneath the sortie in
a rectilinear pattern to measure depths and elevations. The data were collected with
4 9 4 m sounding densities and 200 % seabed coverage, which thereby dictated the
swath width, line spacing and speed of the survey (Table 6.1; Baltsavias 1999). The
data collected for this project met IHO Order 1 uncertainty standards, and were used
by NOAA to update parts of the nautical charts for the west coast of Puerto Rico (i.e.,
Table 6.1 Scan pattern configuration of the LADS Mk II LiDAR system. Adapted from
Stephenson and Sinclair (2006)
Sounding
density (m)
Swath
width (m)
Line spacing 200 %
coverage (m)
Line spacing 100 %
coverage (m)
Survey speed
(kts)
6 9 6
288
125
250
210
5 9 5
240
100
200
175
4 9 4
192
80
160
140
4a 9 4a
150
60
120
175
3 9 3
100
40
80
150
2 9 2
50
20
40
140
Each pattern is available at all of the operational altitudes (e.g., 500–1,000 m in 100 m
increments)
6 LiDAR Applications
147