

capture clusters of 3-D points. As the FW LiDAR laser energy penetrates into the
vegetation canopy, the returned waveforms are directly linked with the vertical and
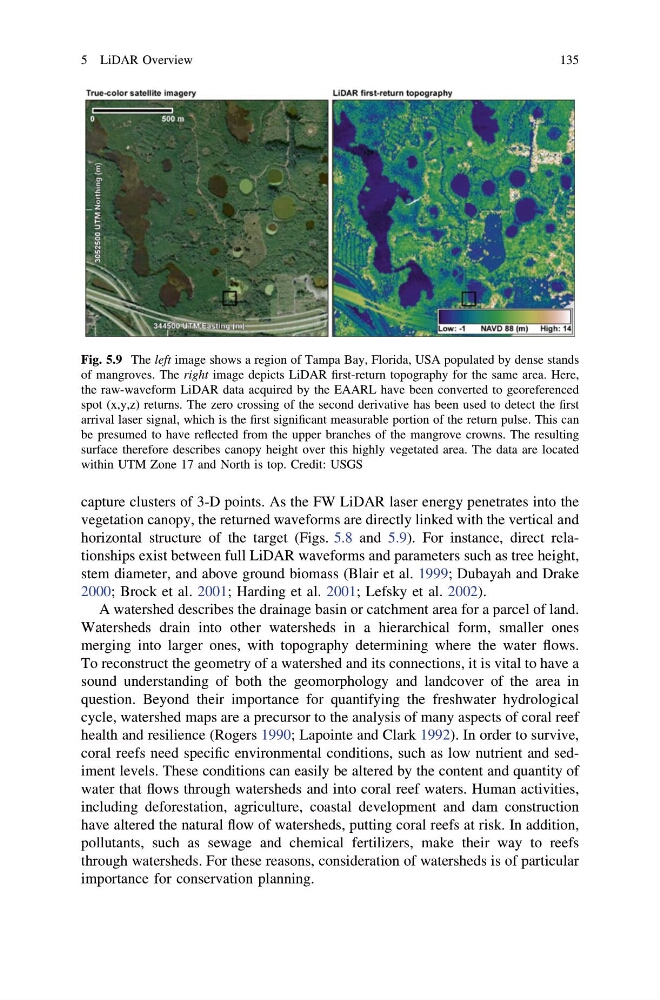
horizontal structure of the target (Figs. 5.8 and 5.9). For instance, direct relationships exist between full LiDAR waveforms and parameters such as tree height,
stem diameter, and above ground biomass (Blair et al. 1999; Dubayah and Drake
2000; Brock et al. 2001; Harding et al. 2001; Lefsky et al. 2002).
A watershed describes the drainage basin or catchment area for a parcel of land.
Watersheds drain into other watersheds in a hierarchical form, smaller ones
merging into larger ones, with topography determining where the water flows.
To reconstruct the geometry of a watershed and its connections, it is vital to have a
sound understanding of both the geomorphology and landcover of the area in
question. Beyond their importance for quantifying the freshwater hydrological
cycle, watershed maps are a precursor to the analysis of many aspects of coral reef
health and resilience (Rogers 1990; Lapointe and Clark 1992). In order to survive,
coral reefs need specific environmental conditions, such as low nutrient and sediment levels. These conditions can easily be altered by the content and quantity of
water that flows through watersheds and into coral reef waters. Human activities,
including deforestation, agriculture, coastal development and dam construction
have altered the natural flow of watersheds, putting coral reefs at risk. In addition,
pollutants, such as sewage and chemical fertilizers, make their way to reefs
through watersheds. For these reasons, consideration of watersheds is of particular
importance for conservation planning.
Fig. 5.9 The left image shows a region of Tampa Bay, Florida, USA populated by dense stands
of mangroves. The right image depicts LiDAR first-return topography for the same area. Here,
the raw-waveform LiDAR data acquired by the EAARL have been converted to georeferenced
spot (x,y,z) returns. The zero crossing of the second derivative has been used to detect the first
arrival laser signal, which is the first significant measurable portion of the return pulse. This can
be presumed to have reflected from the upper branches of the mangrove crowns. The resulting
surface therefore describes canopy height over this highly vegetated area. The data are located
within UTM Zone 17 and North is top. Credit: USGS
5 LiDAR Overview
135
vegetation canopy, the returned waveforms are directly linked with the vertical and
horizontal structure of the target (Figs. 5.8 and 5.9). For instance, direct relationships exist between full LiDAR waveforms and parameters such as tree height,
stem diameter, and above ground biomass (Blair et al. 1999; Dubayah and Drake
2000; Brock et al. 2001; Harding et al. 2001; Lefsky et al. 2002).
A watershed describes the drainage basin or catchment area for a parcel of land.
Watersheds drain into other watersheds in a hierarchical form, smaller ones
merging into larger ones, with topography determining where the water flows.
To reconstruct the geometry of a watershed and its connections, it is vital to have a
sound understanding of both the geomorphology and landcover of the area in
question. Beyond their importance for quantifying the freshwater hydrological
cycle, watershed maps are a precursor to the analysis of many aspects of coral reef
health and resilience (Rogers 1990; Lapointe and Clark 1992). In order to survive,
coral reefs need specific environmental conditions, such as low nutrient and sediment levels. These conditions can easily be altered by the content and quantity of
water that flows through watersheds and into coral reef waters. Human activities,
including deforestation, agriculture, coastal development and dam construction
have altered the natural flow of watersheds, putting coral reefs at risk. In addition,
pollutants, such as sewage and chemical fertilizers, make their way to reefs
through watersheds. For these reasons, consideration of watersheds is of particular
importance for conservation planning.
Fig. 5.9 The left image shows a region of Tampa Bay, Florida, USA populated by dense stands
of mangroves. The right image depicts LiDAR first-return topography for the same area. Here,
the raw-waveform LiDAR data acquired by the EAARL have been converted to georeferenced
spot (x,y,z) returns. The zero crossing of the second derivative has been used to detect the first
arrival laser signal, which is the first significant measurable portion of the return pulse. This can
be presumed to have reflected from the upper branches of the mangrove crowns. The resulting
surface therefore describes canopy height over this highly vegetated area. The data are located
within UTM Zone 17 and North is top. Credit: USGS
5 LiDAR Overview
135