

Stumpf et al. 2003; Lyzenga et al. 2006), else derived empirically or via optimisation when hyperspectral information is captured (Gordon and Morel 1983; Lee
et al. 1999; Dekker 1993; Durand et al. 2000; Hedley and Mumby 2003). However,
the relationships of attenuation on which these methods are based are often tenuous
and even under optimum conditions, such techniques cannot match the accuracy or
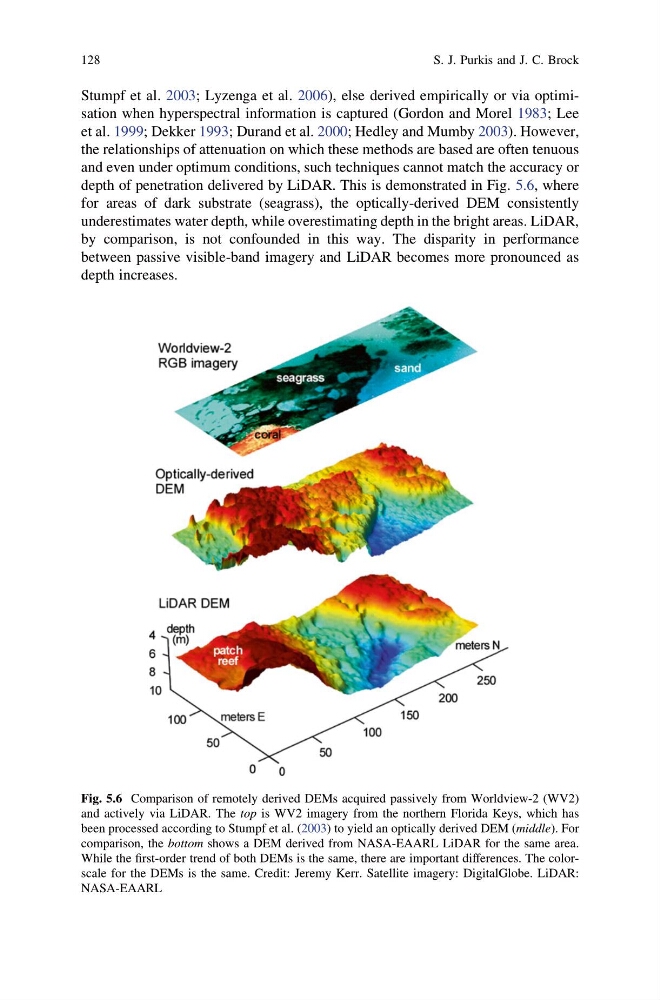
depth of penetration delivered by LiDAR. This is demonstrated in Fig. 5.6, where
for areas of dark substrate (seagrass), the optically-derived DEM consistently
underestimates water depth, while overestimating depth in the bright areas. LiDAR,
by comparison, is not confounded in this way. The disparity in performance
between passive visible-band imagery and LiDAR becomes more pronounced as
depth increases.
Fig. 5.6 Comparison of remotely derived DEMs acquired passively from Worldview-2 (WV2)
and actively via LiDAR. The top is WV2 imagery from the northern Florida Keys, which has
been processed according to Stumpf et al. (2003) to yield an optically derived DEM (middle). For
comparison, the bottom shows a DEM derived from NASA-EAARL LiDAR for the same area.
While the first-order trend of both DEMs is the same, there are important differences. The colorscale for the DEMs is the same. Credit: Jeremy Kerr. Satellite imagery: DigitalGlobe. LiDAR:
NASA-EAARL
128
S. J. Purkis and J. C. Brock
et al. 1999; Dekker 1993; Durand et al. 2000; Hedley and Mumby 2003). However,
the relationships of attenuation on which these methods are based are often tenuous
and even under optimum conditions, such techniques cannot match the accuracy or
depth of penetration delivered by LiDAR. This is demonstrated in Fig. 5.6, where
for areas of dark substrate (seagrass), the optically-derived DEM consistently
underestimates water depth, while overestimating depth in the bright areas. LiDAR,
by comparison, is not confounded in this way. The disparity in performance
between passive visible-band imagery and LiDAR becomes more pronounced as
depth increases.
Fig. 5.6 Comparison of remotely derived DEMs acquired passively from Worldview-2 (WV2)
and actively via LiDAR. The top is WV2 imagery from the northern Florida Keys, which has
been processed according to Stumpf et al. (2003) to yield an optically derived DEM (middle). For
comparison, the bottom shows a DEM derived from NASA-EAARL LiDAR for the same area.
While the first-order trend of both DEMs is the same, there are important differences. The colorscale for the DEMs is the same. Credit: Jeremy Kerr. Satellite imagery: DigitalGlobe. LiDAR:
NASA-EAARL
128
S. J. Purkis and J. C. Brock