

chlorophyll and in addition the main accessory pigments for coral symbionts and
brown algae, peridinin and fucoxanthin respectively, have similar spectral profiles
(Jeffery et al. 1997).
Different reef management objectives require benthic mapping at different levels
of descriptive detail. At the most ambitious end of the scale are objectives such as
quantification of live coral cover, discrimination of live coral versus dead coral
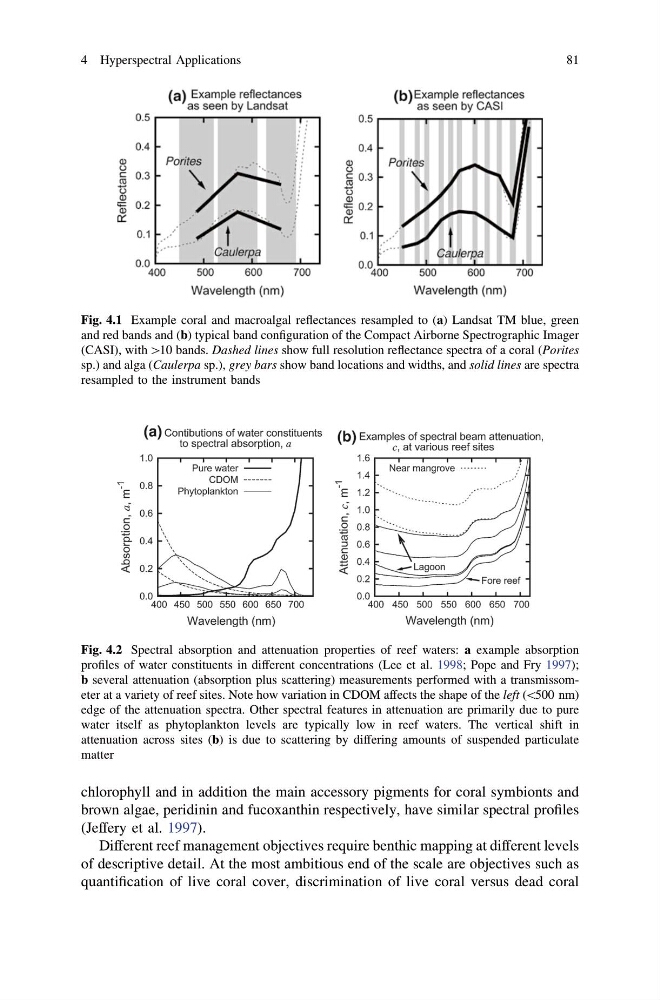
Fig. 4.1 Example coral and macroalgal reflectances resampled to (a) Landsat TM blue, green
and red bands and (b) typical band configuration of the Compact Airborne Spectrographic Imager
(CASI), with [10 bands. Dashed lines show full resolution reflectance spectra of a coral (Porites
sp.) and alga (Caulerpa sp.), grey bars show band locations and widths, and solid lines are spectra
resampled to the instrument bands
Fig. 4.2 Spectral absorption and attenuation properties of reef waters: a example absorption
profiles of water constituents in different concentrations (Lee et al. 1998; Pope and Fry 1997);
b several attenuation (absorption plus scattering) measurements performed with a transmissometer at a variety of reef sites. Note how variation in CDOM affects the shape of the left (\500 nm)
edge of the attenuation spectra. Other spectral features in attenuation are primarily due to pure
water itself as phytoplankton levels are typically low in reef waters. The vertical shift in
attenuation across sites (b) is due to scattering by differing amounts of suspended particulate
matter
4 Hyperspectral Applications
81
brown algae, peridinin and fucoxanthin respectively, have similar spectral profiles
(Jeffery et al. 1997).
Different reef management objectives require benthic mapping at different levels
of descriptive detail. At the most ambitious end of the scale are objectives such as
quantification of live coral cover, discrimination of live coral versus dead coral
Fig. 4.1 Example coral and macroalgal reflectances resampled to (a) Landsat TM blue, green
and red bands and (b) typical band configuration of the Compact Airborne Spectrographic Imager
(CASI), with [10 bands. Dashed lines show full resolution reflectance spectra of a coral (Porites
sp.) and alga (Caulerpa sp.), grey bars show band locations and widths, and solid lines are spectra
resampled to the instrument bands
Fig. 4.2 Spectral absorption and attenuation properties of reef waters: a example absorption
profiles of water constituents in different concentrations (Lee et al. 1998; Pope and Fry 1997);
b several attenuation (absorption plus scattering) measurements performed with a transmissometer at a variety of reef sites. Note how variation in CDOM affects the shape of the left (\500 nm)
edge of the attenuation spectra. Other spectral features in attenuation are primarily due to pure
water itself as phytoplankton levels are typically low in reef waters. The vertical shift in
attenuation across sites (b) is due to scattering by differing amounts of suspended particulate
matter
4 Hyperspectral Applications
81