

built-up density inside urban area. Correspondingly, the coverage of vegetated area
shrinks. Some barren lands detected in earlier years and are replaced by built-up
area successively. Furthermore, the newly emerged barren lands are mostly located
on the fringe of the urban built-up area.
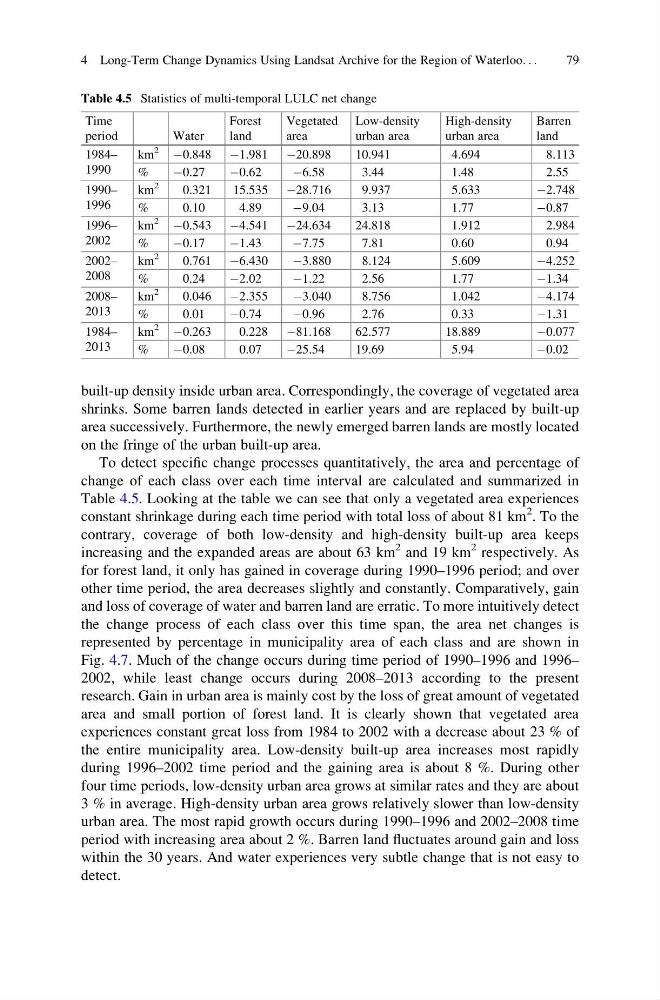
To detect specific change processes quantitatively, the area and percentage of
change of each class over each time interval are calculated and summarized in
Table 4.5. Looking at the table we can see that only a vegetated area experiences
constant shrinkage during each time period with total loss of about 81 km
2 . To the
contrary, coverage of both low-density and high-density built-up area keeps
increasing and the expanded areas are about 63 km
2 and 19 km
2 respectively. As
for forest land, it only has gained in coverage during 1990–1996 period; and over
other time period, the area decreases slightly and constantly. Comparatively, gain
and loss of coverage of water and barren land are erratic. To more intuitively detect
the change process of each class over this time span, the area net changes is
represented by percentage in municipality area of each class and are shown in
Fig. 4.7. Much of the change occurs during time period of 1990–1996 and 1996–
2002, while least change occurs during 2008–2013 according to the present
research. Gain in urban area is mainly cost by the loss of great amount of vegetated
area and small portion of forest land. It is clearly shown that vegetated area
experiences constant great loss from 1984 to 2002 with a decrease about 23 % of
the entire municipality area. Low-density built-up area increases most rapidly
during 1996–2002 time period and the gaining area is about 8 %. During other
four time periods, low-density urban area grows at similar rates and they are about
3 % in average. High-density urban area grows relatively slower than low-density
urban area. The most rapid growth occurs during 1990–1996 and 2002–2008 time
period with increasing area about 2 %. Barren land fluctuates around gain and loss
within the 30 years. And water experiences very subtle change that is not easy to
detect.
Table 4.5 Statistics of multi-temporal LULC net change
Time
period
Water
Forest
land
Vegetated
area
Low-density
urban area
High-density
urban area
Barren
land
1984–
1990
km
2
À0.848 À1.981 À20.898
10.941
4.694
8.113
%
À0.27
À0.62
À6.58
3.44
1.48
2.55
1990–
1996
km
2
0.321
15.535 À28.716
9.937
5.633
À2.748
%
0.10
4.89
À9.04
3.13
1.77
À0.87
1996–
2002
km
2
À0.543 À4.541 À24.634
24.818
1.912
2.984
%
À0.17
À1.43
À7.75
7.81
0.60
0.94
2002–
2008
km
2
0.761 À6.430
À3.880
8.124
5.609
À4.252
%
0.24
À2.02
À1.22
2.56
1.77
À1.34
2008–
2013
km
2
0.046 À2.355
À3.040
8.756
1.042
À4.174
%
0.01
À0.74
À0.96
2.76
0.33
À1.31
1984–
2013
km
2
À0.263
0.228 À81.168
62.577
18.889
À0.077
%
À0.08
0.07
À25.54
19.69
5.94
À0.02
4 Long-Term Change Dynamics Using Landsat Archive for the Region of Waterloo. . .
79
shrinks. Some barren lands detected in earlier years and are replaced by built-up
area successively. Furthermore, the newly emerged barren lands are mostly located
on the fringe of the urban built-up area.
To detect specific change processes quantitatively, the area and percentage of
change of each class over each time interval are calculated and summarized in
Table 4.5. Looking at the table we can see that only a vegetated area experiences
constant shrinkage during each time period with total loss of about 81 km
2 . To the
contrary, coverage of both low-density and high-density built-up area keeps
increasing and the expanded areas are about 63 km
2 and 19 km
2 respectively. As
for forest land, it only has gained in coverage during 1990–1996 period; and over
other time period, the area decreases slightly and constantly. Comparatively, gain
and loss of coverage of water and barren land are erratic. To more intuitively detect
the change process of each class over this time span, the area net changes is
represented by percentage in municipality area of each class and are shown in
Fig. 4.7. Much of the change occurs during time period of 1990–1996 and 1996–
2002, while least change occurs during 2008–2013 according to the present
research. Gain in urban area is mainly cost by the loss of great amount of vegetated
area and small portion of forest land. It is clearly shown that vegetated area
experiences constant great loss from 1984 to 2002 with a decrease about 23 % of
the entire municipality area. Low-density built-up area increases most rapidly
during 1996–2002 time period and the gaining area is about 8 %. During other
four time periods, low-density urban area grows at similar rates and they are about
3 % in average. High-density urban area grows relatively slower than low-density
urban area. The most rapid growth occurs during 1990–1996 and 2002–2008 time
period with increasing area about 2 %. Barren land fluctuates around gain and loss
within the 30 years. And water experiences very subtle change that is not easy to
detect.
Table 4.5 Statistics of multi-temporal LULC net change
Time
period
Water
Forest
land
Vegetated
area
Low-density
urban area
High-density
urban area
Barren
land
1984–
1990
km
2
À0.848 À1.981 À20.898
10.941
4.694
8.113
%
À0.27
À0.62
À6.58
3.44
1.48
2.55
1990–
1996
km
2
0.321
15.535 À28.716
9.937
5.633
À2.748
%
0.10
4.89
À9.04
3.13
1.77
À0.87
1996–
2002
km
2
À0.543 À4.541 À24.634
24.818
1.912
2.984
%
À0.17
À1.43
À7.75
7.81
0.60
0.94
2002–
2008
km
2
0.761 À6.430
À3.880
8.124
5.609
À4.252
%
0.24
À2.02
À1.22
2.56
1.77
À1.34
2008–
2013
km
2
0.046 À2.355
À3.040
8.756
1.042
À4.174
%
0.01
À0.74
À0.96
2.76
0.33
À1.31
1984–
2013
km
2
À0.263
0.228 À81.168
62.577
18.889
À0.077
%
À0.08
0.07
À25.54
19.69
5.94
À0.02
4 Long-Term Change Dynamics Using Landsat Archive for the Region of Waterloo. . .
79