

significant spatial change of LULC types can be obtained; and confusion matrix
showing very detailed statistical “from-to” information of each class can be
generated.
4.4 Change Detection Analysis
4.4.1 Multi-temporal Change Detection Analysis
To detect relatively more detailed change processes over the 30-year time period
than bi-temporal approach, multi-temporal change detection has been conducted
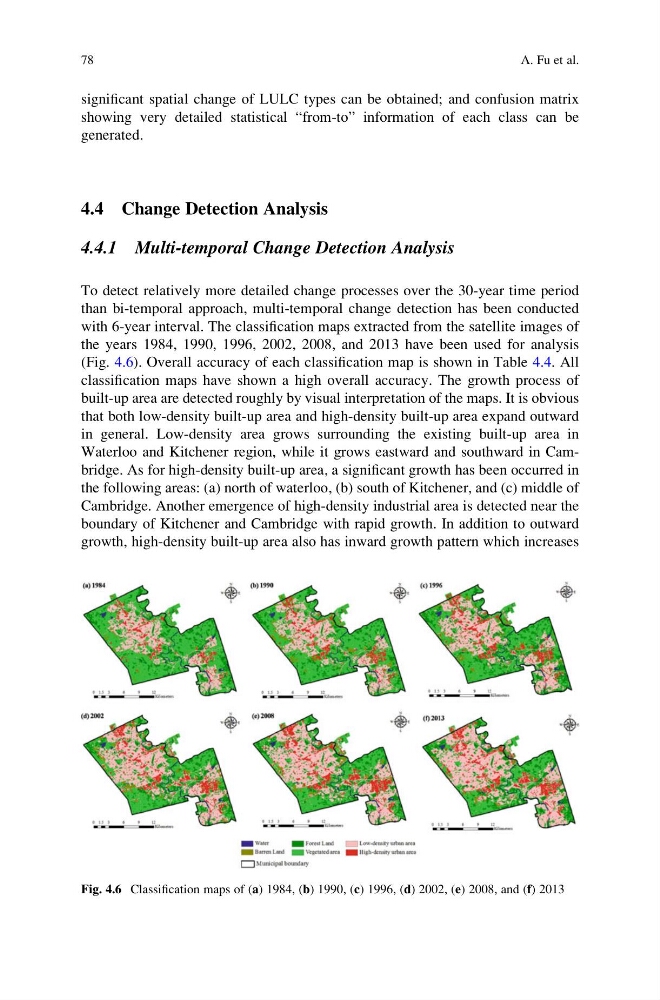
with 6-year interval. The classification maps extracted from the satellite images of
the years 1984, 1990, 1996, 2002, 2008, and 2013 have been used for analysis
(Fig. 4.6). Overall accuracy of each classification map is shown in Table 4.4. All
classification maps have shown a high overall accuracy. The growth process of
built-up area are detected roughly by visual interpretation of the maps. It is obvious
that both low-density built-up area and high-density built-up area expand outward
in general. Low-density area grows surrounding the existing built-up area in
Waterloo and Kitchener region, while it grows eastward and southward in Cambridge. As for high-density built-up area, a significant growth has been occurred in
the following areas: (a) north of waterloo, (b) south of Kitchener, and (c) middle of
Cambridge. Another emergence of high-density industrial area is detected near the
boundary of Kitchener and Cambridge with rapid growth. In addition to outward
growth, high-density built-up area also has inward growth pattern which increases
Fig. 4.6 Classification maps of (a) 1984, (b) 1990, (c) 1996, (d) 2002, (e) 2008, and (f) 2013
78
A. Fu et al.
showing very detailed statistical “from-to” information of each class can be
generated.
4.4 Change Detection Analysis
4.4.1 Multi-temporal Change Detection Analysis
To detect relatively more detailed change processes over the 30-year time period
than bi-temporal approach, multi-temporal change detection has been conducted
with 6-year interval. The classification maps extracted from the satellite images of
the years 1984, 1990, 1996, 2002, 2008, and 2013 have been used for analysis
(Fig. 4.6). Overall accuracy of each classification map is shown in Table 4.4. All
classification maps have shown a high overall accuracy. The growth process of
built-up area are detected roughly by visual interpretation of the maps. It is obvious
that both low-density built-up area and high-density built-up area expand outward
in general. Low-density area grows surrounding the existing built-up area in
Waterloo and Kitchener region, while it grows eastward and southward in Cambridge. As for high-density built-up area, a significant growth has been occurred in
the following areas: (a) north of waterloo, (b) south of Kitchener, and (c) middle of
Cambridge. Another emergence of high-density industrial area is detected near the
boundary of Kitchener and Cambridge with rapid growth. In addition to outward
growth, high-density built-up area also has inward growth pattern which increases
Fig. 4.6 Classification maps of (a) 1984, (b) 1990, (c) 1996, (d) 2002, (e) 2008, and (f) 2013
78
A. Fu et al.