

used for the analysis. For a better orientation of the project the fortification had been
divided into 18 work packages. The orientation and processing of images had been
performed using PhotoModeller Pro software developed by Canadian company Eos
Systems Inc.
Relative orientation components were calculated using aerial images completed
with closely selected terrestrial images. Twenty-three images covering the entire
object had been oriented at the beginning. Photographs with fine resolution and
with maximum overlap were preferred. Tie points that connected were selected on
fortification facades, building roofs in interior and in surrounding terrain (hillsides,
low walls and communication under the Citadel). The relative orientation had been
extended by 11 photographs in order to enlarge intersections between images and
for better processing of the chosen objects inside the Citadel.
Absolute orientation on previously surveyed and adjusted ground control points
followed. Quantity and distribution of ground control points had to be analyzed.
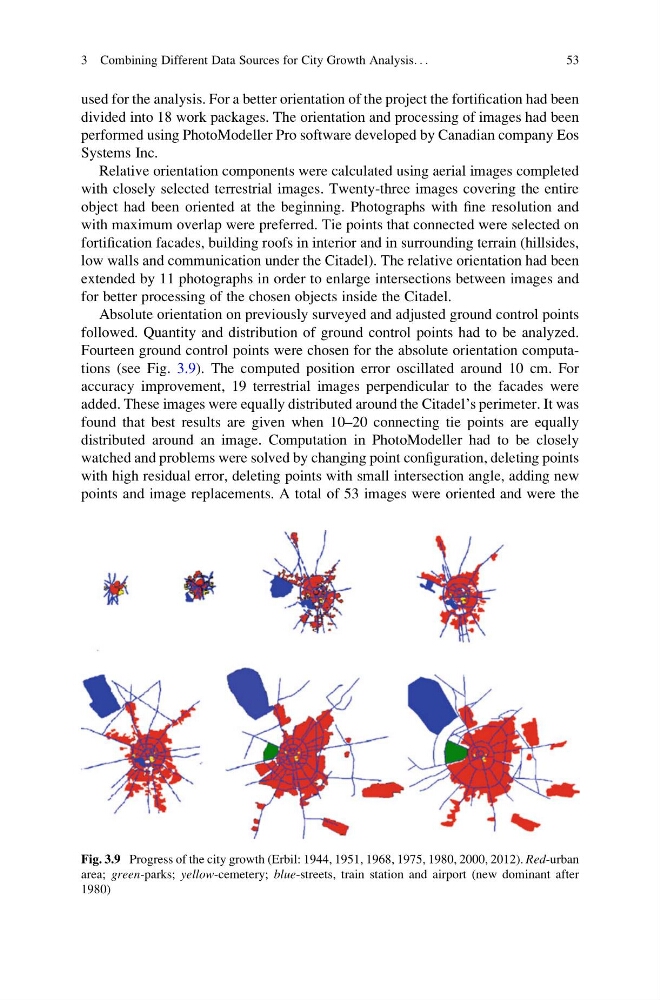
Fourteen ground control points were chosen for the absolute orientation computations (see Fig. 3.9). The computed position error oscillated around 10 cm. For
accuracy improvement, 19 terrestrial images perpendicular to the facades were
added. These images were equally distributed around the Citadel’s perimeter. It was
found that best results are given when 10–20 connecting tie points are equally
distributed around an image. Computation in PhotoModeller had to be closely
watched and problems were solved by changing point configuration, deleting points
with high residual error, deleting points with small intersection angle, adding new
points and image replacements. A total of 53 images were oriented and were the
Fig. 3.9 Progress of the city growth (Erbil: 1944, 1951, 1968, 1975, 1980, 2000, 2012). Red-urban
area; green-parks; yellow-cemetery; blue-streets, train station and airport (new dominant after
1980)
3 Combining Different Data Sources for City Growth Analysis. . .
53
divided into 18 work packages. The orientation and processing of images had been
performed using PhotoModeller Pro software developed by Canadian company Eos
Systems Inc.
Relative orientation components were calculated using aerial images completed
with closely selected terrestrial images. Twenty-three images covering the entire
object had been oriented at the beginning. Photographs with fine resolution and
with maximum overlap were preferred. Tie points that connected were selected on
fortification facades, building roofs in interior and in surrounding terrain (hillsides,
low walls and communication under the Citadel). The relative orientation had been
extended by 11 photographs in order to enlarge intersections between images and
for better processing of the chosen objects inside the Citadel.
Absolute orientation on previously surveyed and adjusted ground control points
followed. Quantity and distribution of ground control points had to be analyzed.
Fourteen ground control points were chosen for the absolute orientation computations (see Fig. 3.9). The computed position error oscillated around 10 cm. For
accuracy improvement, 19 terrestrial images perpendicular to the facades were
added. These images were equally distributed around the Citadel’s perimeter. It was
found that best results are given when 10–20 connecting tie points are equally
distributed around an image. Computation in PhotoModeller had to be closely
watched and problems were solved by changing point configuration, deleting points
with high residual error, deleting points with small intersection angle, adding new
points and image replacements. A total of 53 images were oriented and were the
Fig. 3.9 Progress of the city growth (Erbil: 1944, 1951, 1968, 1975, 1980, 2000, 2012). Red-urban
area; green-parks; yellow-cemetery; blue-streets, train station and airport (new dominant after
1980)
3 Combining Different Data Sources for City Growth Analysis. . .
53