

stream flow. Annual and flood seasonal stream flows trended to decrease from 1979
to 2008, whereas dry seasonal stream flow had rising trends. Annual and seasonal
evaporation seemed to increase. In addition, stream flow and evaporation have
same trends as precipitation and temperature (Table 2.1 and Fig. 2.4), respectively.
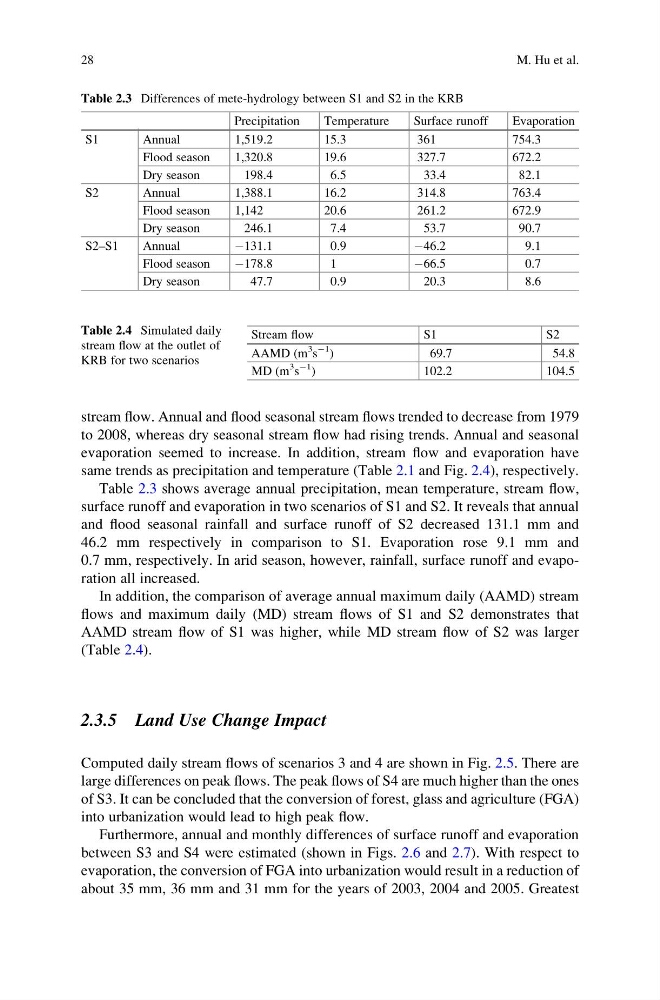
Table 2.3 shows average annual precipitation, mean temperature, stream flow,
surface runoff and evaporation in two scenarios of S1 and S2. It reveals that annual
and flood seasonal rainfall and surface runoff of S2 decreased 131.1 mm and
46.2 mm respectively in comparison to S1. Evaporation rose 9.1 mm and
0.7 mm, respectively. In arid season, however, rainfall, surface runoff and evaporation all increased.
In addition, the comparison of average annual maximum daily (AAMD) stream
flows and maximum daily (MD) stream flows of S1 and S2 demonstrates that
AAMD stream flow of S1 was higher, while MD stream flow of S2 was larger
(Table 2.4).
2.3.5 Land Use Change Impact
Computed daily stream flows of scenarios 3 and 4 are shown in Fig. 2.5. There are
large differences on peak flows. The peak flows of S4 are much higher than the ones
of S3. It can be concluded that the conversion of forest, glass and agriculture (FGA)
into urbanization would lead to high peak flow.
Furthermore, annual and monthly differences of surface runoff and evaporation
between S3 and S4 were estimated (shown in Figs. 2.6 and 2.7). With respect to
evaporation, the conversion of FGA into urbanization would result in a reduction of
about 35 mm, 36 mm and 31 mm for the years of 2003, 2004 and 2005. Greatest
Table 2.3 Differences of mete-hydrology between S1 and S2 in the KRB
Precipitation
Temperature
Surface runoff
Evaporation
S1
Annual
1,519.2
15.3
361
754.3
Flood season
1,320.8
19.6
327.7
672.2
Dry season
198.4
6.5
33.4
82.1
S2
Annual
1,388.1
16.2
314.8
763.4
Flood season
1,142
20.6
261.2
672.9
Dry season
246.1
7.4
53.7
90.7
S2–S1
Annual
À131.1
0.9
À46.2
9.1
Flood season
À178.8
1
À66.5
0.7
Dry season
47.7
0.9
20.3
8.6
Table 2.4 Simulated daily
stream flow at the outlet of
KRB for two scenarios
Stream flow
S1
S2
AAMD (m
3
s
À1
)
69.7
54.8
MD (m
3
s
À1
)
102.2
104.5
28
M. Hu et al.
to 2008, whereas dry seasonal stream flow had rising trends. Annual and seasonal
evaporation seemed to increase. In addition, stream flow and evaporation have
same trends as precipitation and temperature (Table 2.1 and Fig. 2.4), respectively.
Table 2.3 shows average annual precipitation, mean temperature, stream flow,
surface runoff and evaporation in two scenarios of S1 and S2. It reveals that annual
and flood seasonal rainfall and surface runoff of S2 decreased 131.1 mm and
46.2 mm respectively in comparison to S1. Evaporation rose 9.1 mm and
0.7 mm, respectively. In arid season, however, rainfall, surface runoff and evaporation all increased.
In addition, the comparison of average annual maximum daily (AAMD) stream
flows and maximum daily (MD) stream flows of S1 and S2 demonstrates that
AAMD stream flow of S1 was higher, while MD stream flow of S2 was larger
(Table 2.4).
2.3.5 Land Use Change Impact
Computed daily stream flows of scenarios 3 and 4 are shown in Fig. 2.5. There are
large differences on peak flows. The peak flows of S4 are much higher than the ones
of S3. It can be concluded that the conversion of forest, glass and agriculture (FGA)
into urbanization would lead to high peak flow.
Furthermore, annual and monthly differences of surface runoff and evaporation
between S3 and S4 were estimated (shown in Figs. 2.6 and 2.7). With respect to
evaporation, the conversion of FGA into urbanization would result in a reduction of
about 35 mm, 36 mm and 31 mm for the years of 2003, 2004 and 2005. Greatest
Table 2.3 Differences of mete-hydrology between S1 and S2 in the KRB
Precipitation
Temperature
Surface runoff
Evaporation
S1
Annual
1,519.2
15.3
361
754.3
Flood season
1,320.8
19.6
327.7
672.2
Dry season
198.4
6.5
33.4
82.1
S2
Annual
1,388.1
16.2
314.8
763.4
Flood season
1,142
20.6
261.2
672.9
Dry season
246.1
7.4
53.7
90.7
S2–S1
Annual
À131.1
0.9
À46.2
9.1
Flood season
À178.8
1
À66.5
0.7
Dry season
47.7
0.9
20.3
8.6
Table 2.4 Simulated daily
stream flow at the outlet of
KRB for two scenarios
Stream flow
S1
S2
AAMD (m
3
s
À1
)
69.7
54.8
MD (m
3
s
À1
)
102.2
104.5
28
M. Hu et al.