

was most due to errors in rough soil data. There is no initial soil observed data (field
capacity, wilting point, etc.). During the calibration period, correlation coefficients
and NSE were 0.87 % and 0.72, respectively.
During the validation period, simulated daily stream flow at the outlet of the
KRB also captured the observed evolution well. Peak flow simulations improved in
comparison to the calibration period. However, base flow still was underestimated.
Correlation coefficients and NSE were 0.83 % and 0.69, respectively.
2.3.4 Climate Change Impact
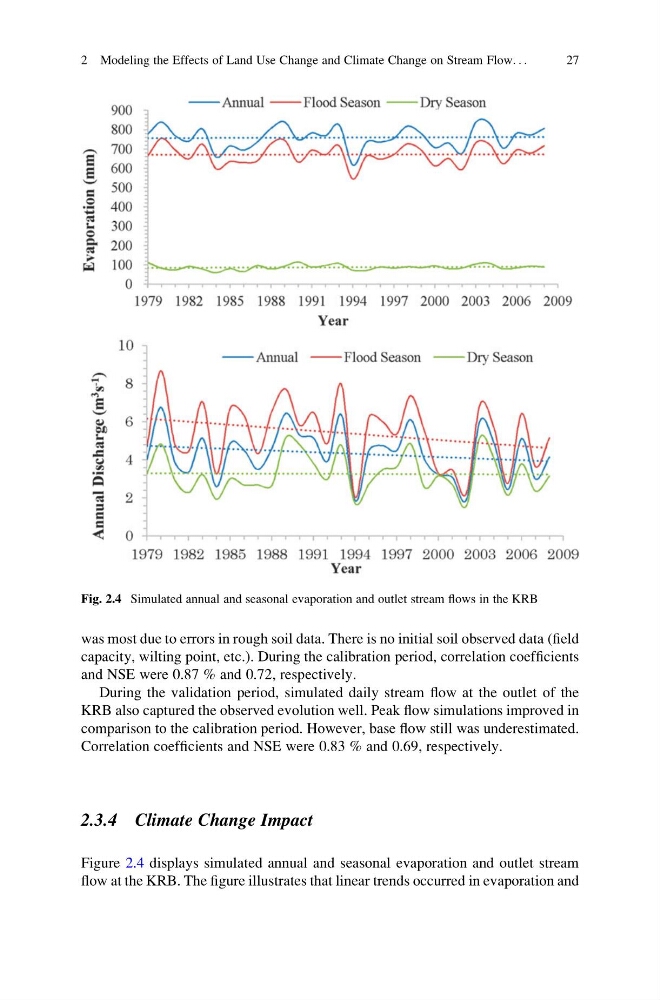
Figure 2.4 displays simulated annual and seasonal evaporation and outlet stream
flow at the KRB. The figure illustrates that linear trends occurred in evaporation and
Fig. 2.4 Simulated annual and seasonal evaporation and outlet stream flows in the KRB
2 Modeling the Effects of Land Use Change and Climate Change on Stream Flow. . .
27
capacity, wilting point, etc.). During the calibration period, correlation coefficients
and NSE were 0.87 % and 0.72, respectively.
During the validation period, simulated daily stream flow at the outlet of the
KRB also captured the observed evolution well. Peak flow simulations improved in
comparison to the calibration period. However, base flow still was underestimated.
Correlation coefficients and NSE were 0.83 % and 0.69, respectively.
2.3.4 Climate Change Impact
Figure 2.4 displays simulated annual and seasonal evaporation and outlet stream
flow at the KRB. The figure illustrates that linear trends occurred in evaporation and
Fig. 2.4 Simulated annual and seasonal evaporation and outlet stream flows in the KRB
2 Modeling the Effects of Land Use Change and Climate Change on Stream Flow. . .
27