

ratios by air pollutant deposition (e.g., Rennenberg et al. 1996; Persson and Majdi
1995) or winter conditions, such as prolonged winter thaws (Bourque et al. 2005).
Soil water potential (an indirect measure of SWC) and plant water potential
(a measure of in-canopy foliage water content) have been previously shown to be
strongly correlated (Pabst et al. 1990; Fotelli et al. 2001). Given these conditions,
the WI developed here can be viewed as an indirect measure of SWC and a basis for
SWC-detection in forest-dominated landscapes.
Figure 15.6 provides a spatial comparison between RADARSAT-1 ScanSARderived WI and SWAT-derived, vertically-averaged estimates of volumetric SWC.
Given the rapid growth rate of potato plants and changes in field-surface conditions
during the growing season (3–4 months), emphasis of the second comparison was to
substantiate spatial representation of derived values for a specific time period.
Reasonably good agreement was obtained between estimates, yielding r
2 -values
of 81 % for 15 July, 65 % for 08 August, and 79 % for 01 September, 2005
comparisons (Fig. 15.6). Both r
2 and the position of the regression lines were
found to differ among the three images. Possible reasons for these differences
could be related to differences in (i) rainfall (see Table 15.2 for the Black Brook
Watershed site), (ii) leaf area index (LAI), (iii) misrepresentation of SWC by the
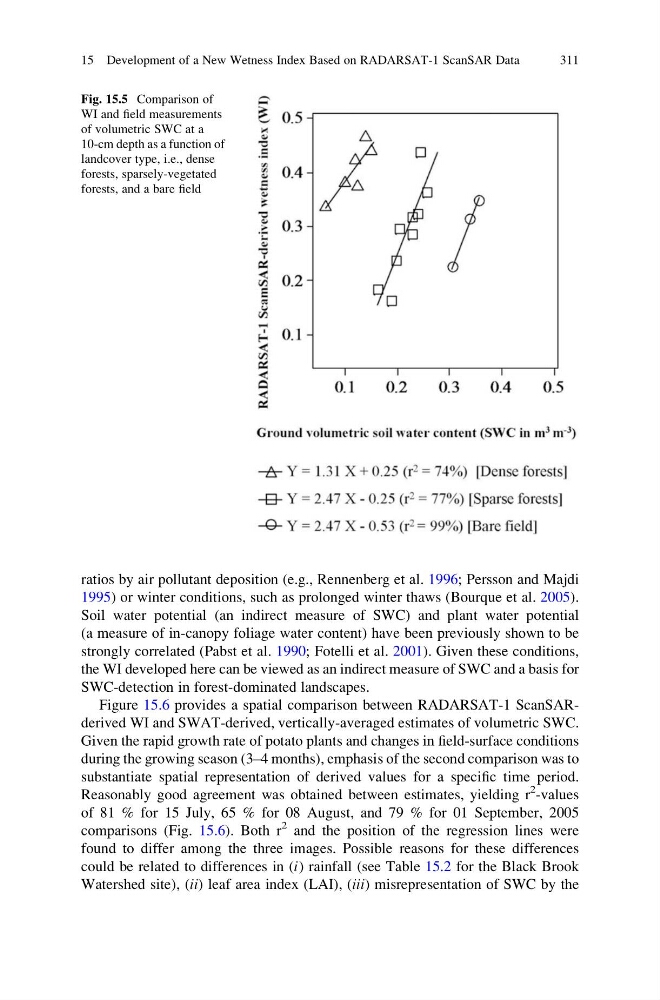
Fig. 15.5 Comparison of
WI and field measurements
of volumetric SWC at a
10-cm depth as a function of
landcover type, i.e., dense
forests, sparsely-vegetated
forests, and a bare field
15 Development of a New Wetness Index Based on RADARSAT-1 ScanSAR Data
311
1995) or winter conditions, such as prolonged winter thaws (Bourque et al. 2005).
Soil water potential (an indirect measure of SWC) and plant water potential
(a measure of in-canopy foliage water content) have been previously shown to be
strongly correlated (Pabst et al. 1990; Fotelli et al. 2001). Given these conditions,
the WI developed here can be viewed as an indirect measure of SWC and a basis for
SWC-detection in forest-dominated landscapes.
Figure 15.6 provides a spatial comparison between RADARSAT-1 ScanSARderived WI and SWAT-derived, vertically-averaged estimates of volumetric SWC.
Given the rapid growth rate of potato plants and changes in field-surface conditions
during the growing season (3–4 months), emphasis of the second comparison was to
substantiate spatial representation of derived values for a specific time period.
Reasonably good agreement was obtained between estimates, yielding r
2 -values
of 81 % for 15 July, 65 % for 08 August, and 79 % for 01 September, 2005
comparisons (Fig. 15.6). Both r
2 and the position of the regression lines were
found to differ among the three images. Possible reasons for these differences
could be related to differences in (i) rainfall (see Table 15.2 for the Black Brook
Watershed site), (ii) leaf area index (LAI), (iii) misrepresentation of SWC by the
Fig. 15.5 Comparison of
WI and field measurements
of volumetric SWC at a
10-cm depth as a function of
landcover type, i.e., dense
forests, sparsely-vegetated
forests, and a bare field
15 Development of a New Wetness Index Based on RADARSAT-1 ScanSAR Data
311