

12.3.1.2 Scenarios of Pvs and Evs Introduction
As mitigation measures, we considered not only land-use change like a compact
city but also the large-scale introduction of EVs and PVs. In each land-use scenario,
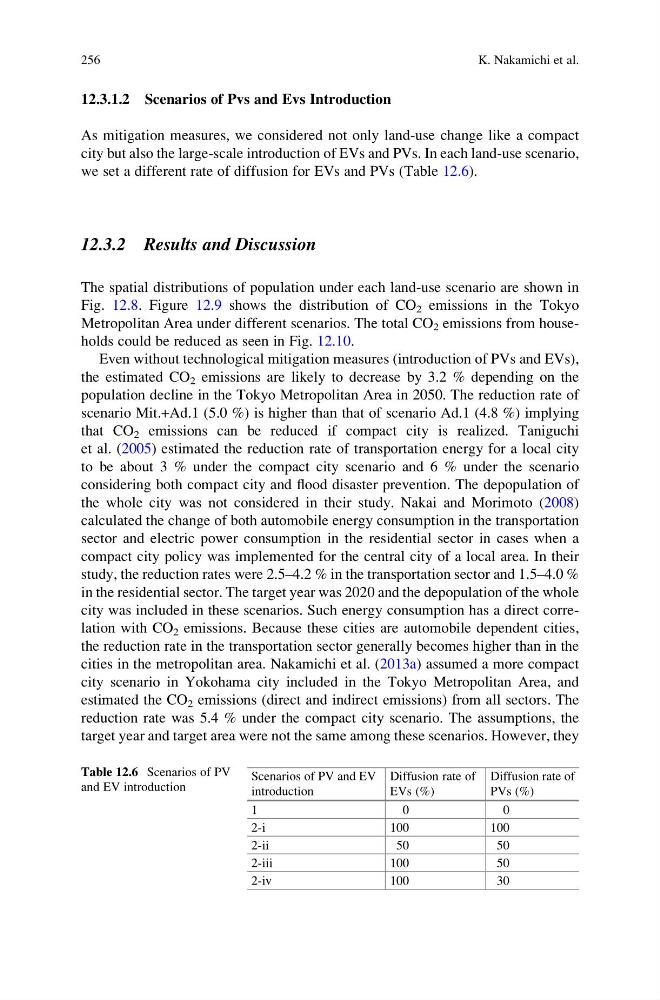
we set a different rate of diffusion for EVs and PVs (Table 12.6).
12.3.2 Results and Discussion
The spatial distributions of population under each land-use scenario are shown in
Fig. 12.8. Figure 12.9 shows the distribution of CO 2 emissions in the Tokyo
Metropolitan Area under different scenarios. The total CO 2 emissions from households could be reduced as seen in Fig. 12.10.
Even without technological mitigation measures (introduction of PVs and EVs),
the estimated CO 2 emissions are likely to decrease by 3.2 % depending on the
population decline in the Tokyo Metropolitan Area in 2050. The reduction rate of
scenario Mit.+Ad.1 (5.0 %) is higher than that of scenario Ad.1 (4.8 %) implying
that CO 2 emissions can be reduced if compact city is realized. Taniguchi
et al. (2005) estimated the reduction rate of transportation energy for a local city
to be about 3 % under the compact city scenario and 6 % under the scenario
considering both compact city and flood disaster prevention. The depopulation of
the whole city was not considered in their study. Nakai and Morimoto (2008)
calculated the change of both automobile energy consumption in the transportation
sector and electric power consumption in the residential sector in cases when a
compact city policy was implemented for the central city of a local area. In their
study, the reduction rates were 2.5–4.2 % in the transportation sector and 1.5–4.0 %
in the residential sector. The target year was 2020 and the depopulation of the whole
city was included in these scenarios. Such energy consumption has a direct correlation with CO 2 emissions. Because these cities are automobile dependent cities,
the reduction rate in the transportation sector generally becomes higher than in the
cities in the metropolitan area. Nakamichi et al. (2013a) assumed a more compact
city scenario in Yokohama city included in the Tokyo Metropolitan Area, and
estimated the CO 2 emissions (direct and indirect emissions) from all sectors. The
reduction rate was 5.4 % under the compact city scenario. The assumptions, the
target year and target area were not the same among these scenarios. However, they
Table 12.6 Scenarios of PV
and EV introduction
Scenarios of PV and EV
introduction
Diffusion rate of
EVs (%)
Diffusion rate of
PVs (%)
1
0
0
2-i
100
100
2-ii
50
50
2-iii
100
50
2-iv
100
30
256
K. Nakamichi et al.
As mitigation measures, we considered not only land-use change like a compact
city but also the large-scale introduction of EVs and PVs. In each land-use scenario,
we set a different rate of diffusion for EVs and PVs (Table 12.6).
12.3.2 Results and Discussion
The spatial distributions of population under each land-use scenario are shown in
Fig. 12.8. Figure 12.9 shows the distribution of CO 2 emissions in the Tokyo
Metropolitan Area under different scenarios. The total CO 2 emissions from households could be reduced as seen in Fig. 12.10.
Even without technological mitigation measures (introduction of PVs and EVs),
the estimated CO 2 emissions are likely to decrease by 3.2 % depending on the
population decline in the Tokyo Metropolitan Area in 2050. The reduction rate of
scenario Mit.+Ad.1 (5.0 %) is higher than that of scenario Ad.1 (4.8 %) implying
that CO 2 emissions can be reduced if compact city is realized. Taniguchi
et al. (2005) estimated the reduction rate of transportation energy for a local city
to be about 3 % under the compact city scenario and 6 % under the scenario
considering both compact city and flood disaster prevention. The depopulation of
the whole city was not considered in their study. Nakai and Morimoto (2008)
calculated the change of both automobile energy consumption in the transportation
sector and electric power consumption in the residential sector in cases when a
compact city policy was implemented for the central city of a local area. In their
study, the reduction rates were 2.5–4.2 % in the transportation sector and 1.5–4.0 %
in the residential sector. The target year was 2020 and the depopulation of the whole
city was included in these scenarios. Such energy consumption has a direct correlation with CO 2 emissions. Because these cities are automobile dependent cities,
the reduction rate in the transportation sector generally becomes higher than in the
cities in the metropolitan area. Nakamichi et al. (2013a) assumed a more compact
city scenario in Yokohama city included in the Tokyo Metropolitan Area, and
estimated the CO 2 emissions (direct and indirect emissions) from all sectors. The
reduction rate was 5.4 % under the compact city scenario. The assumptions, the
target year and target area were not the same among these scenarios. However, they
Table 12.6 Scenarios of PV
and EV introduction
Scenarios of PV and EV
introduction
Diffusion rate of
EVs (%)
Diffusion rate of
PVs (%)
1
0
0
2-i
100
100
2-ii
50
50
2-iii
100
50
2-iv
100
30
256
K. Nakamichi et al.