

11.4.3 Analysis Result of Mean Shallow Landslide Risk
Based on the simulation result from the hydro-geotechnical model, the monthly
shallow landslide risk has been calculated as a percentage. The different risk levels
have been divided into five levels which are 0–10 %, 10–30 %, 30–85 %, 85–98 %,
98–100 % levels (Table 11.2). Stable conditions are reflected by a score of 0–10 %.
The detailed description of the other five risk levels is shown in Table 11.2.
Figure 11.10 shows the mean shallow landslide risk, which is calculated based on
the monthly shallow landslide information and presents a spatial distribution of the
shallow landslide risk. Figure 11.10 shows that landslide risk is principally located
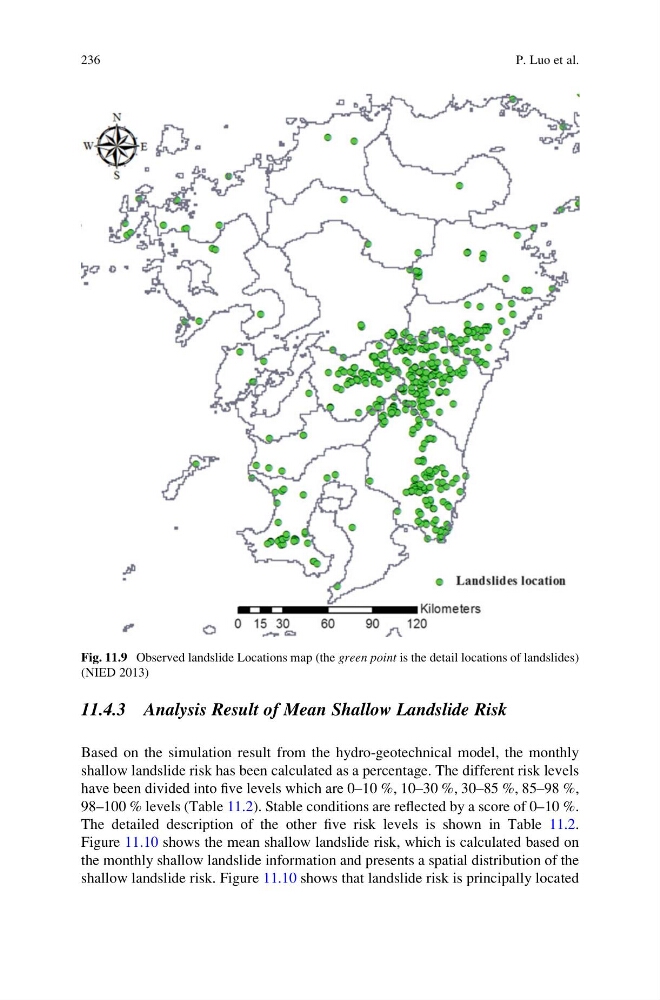
Fig. 11.9 Observed landslide Locations map (the green point is the detail locations of landslides)
(NIED 2013)
236
P. Luo et al.
Based on the simulation result from the hydro-geotechnical model, the monthly
shallow landslide risk has been calculated as a percentage. The different risk levels
have been divided into five levels which are 0–10 %, 10–30 %, 30–85 %, 85–98 %,
98–100 % levels (Table 11.2). Stable conditions are reflected by a score of 0–10 %.
The detailed description of the other five risk levels is shown in Table 11.2.
Figure 11.10 shows the mean shallow landslide risk, which is calculated based on
the monthly shallow landslide information and presents a spatial distribution of the
shallow landslide risk. Figure 11.10 shows that landslide risk is principally located
Fig. 11.9 Observed landslide Locations map (the green point is the detail locations of landslides)
(NIED 2013)
236
P. Luo et al.