

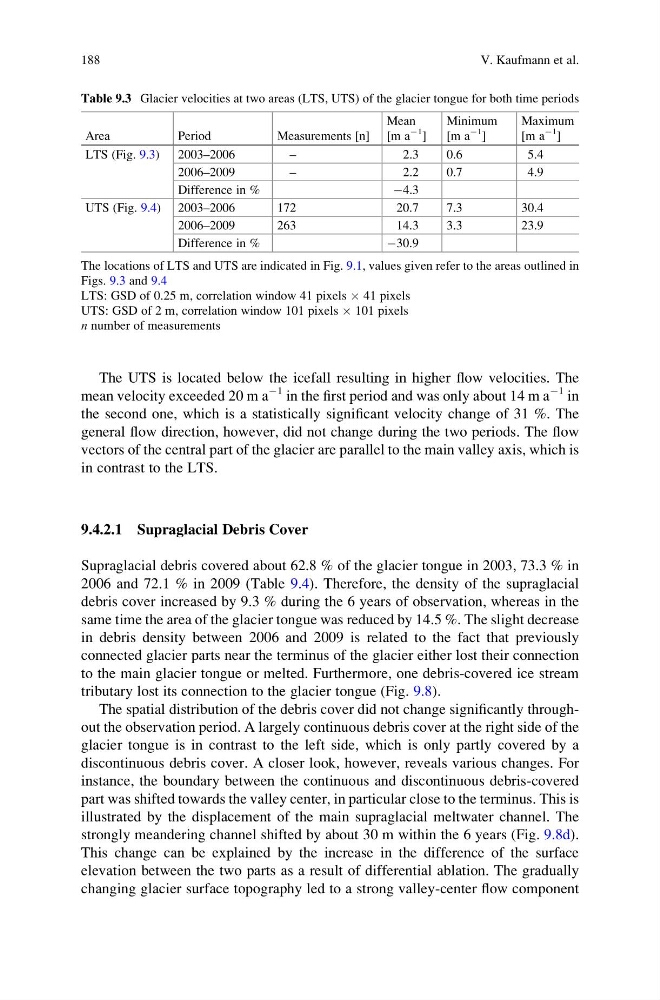
The UTS is located below the icefall resulting in higher flow velocities. The
mean velocity exceeded 20 m a
À1 in the first period and was only about 14 m a
À1 in
the second one, which is a statistically significant velocity change of 31 %. The
general flow direction, however, did not change during the two periods. The flow
vectors of the central part of the glacier are parallel to the main valley axis, which is
in contrast to the LTS.
9.4.2.1 Supraglacial Debris Cover
Supraglacial debris covered about 62.8 % of the glacier tongue in 2003, 73.3 % in
2006 and 72.1 % in 2009 (Table 9.4). Therefore, the density of the supraglacial
debris cover increased by 9.3 % during the 6 years of observation, whereas in the
same time the area of the glacier tongue was reduced by 14.5 %. The slight decrease
in debris density between 2006 and 2009 is related to the fact that previously
connected glacier parts near the terminus of the glacier either lost their connection
to the main glacier tongue or melted. Furthermore, one debris-covered ice stream
tributary lost its connection to the glacier tongue (Fig. 9.8).
The spatial distribution of the debris cover did not change significantly throughout the observation period. A largely continuous debris cover at the right side of the
glacier tongue is in contrast to the left side, which is only partly covered by a
discontinuous debris cover. A closer look, however, reveals various changes. For
instance, the boundary between the continuous and discontinuous debris-covered
part was shifted towards the valley center, in particular close to the terminus. This is
illustrated by the displacement of the main supraglacial meltwater channel. The
strongly meandering channel shifted by about 30 m within the 6 years (Fig. 9.8d).
This change can be explained by the increase in the difference of the surface
elevation between the two parts as a result of differential ablation. The gradually
changing glacier surface topography led to a strong valley-center flow component
Table 9.3 Glacier velocities at two areas (LTS, UTS) of the glacier tongue for both time periods
Area
Period
Measurements [n]
Mean
[m a
À1
]
Minimum
[m a
À1
]
Maximum
[m a
À1
]
LTS (Fig. 9.3) 2003–2006
–
2.3
0.6
5.4
2006–2009
–
2.2
0.7
4.9
Difference in %
À4.3
UTS (Fig. 9.4) 2003–2006
172
20.7
7.3
30.4
2006–2009
263
14.3
3.3
23.9
Difference in %
À30.9
The locations of LTS and UTS are indicated in Fig. 9.1, values given refer to the areas outlined in
Figs. 9.3 and 9.4
LTS: GSD of 0.25 m, correlation window 41 pixels  41 pixels
UTS: GSD of 2 m, correlation window 101 pixels  101 pixels
n number of measurements
188
V. Kaufmann et al.
mean velocity exceeded 20 m a
À1 in the first period and was only about 14 m a
À1 in
the second one, which is a statistically significant velocity change of 31 %. The
general flow direction, however, did not change during the two periods. The flow
vectors of the central part of the glacier are parallel to the main valley axis, which is
in contrast to the LTS.
9.4.2.1 Supraglacial Debris Cover
Supraglacial debris covered about 62.8 % of the glacier tongue in 2003, 73.3 % in
2006 and 72.1 % in 2009 (Table 9.4). Therefore, the density of the supraglacial
debris cover increased by 9.3 % during the 6 years of observation, whereas in the
same time the area of the glacier tongue was reduced by 14.5 %. The slight decrease
in debris density between 2006 and 2009 is related to the fact that previously
connected glacier parts near the terminus of the glacier either lost their connection
to the main glacier tongue or melted. Furthermore, one debris-covered ice stream
tributary lost its connection to the glacier tongue (Fig. 9.8).
The spatial distribution of the debris cover did not change significantly throughout the observation period. A largely continuous debris cover at the right side of the
glacier tongue is in contrast to the left side, which is only partly covered by a
discontinuous debris cover. A closer look, however, reveals various changes. For
instance, the boundary between the continuous and discontinuous debris-covered
part was shifted towards the valley center, in particular close to the terminus. This is
illustrated by the displacement of the main supraglacial meltwater channel. The
strongly meandering channel shifted by about 30 m within the 6 years (Fig. 9.8d).
This change can be explained by the increase in the difference of the surface
elevation between the two parts as a result of differential ablation. The gradually
changing glacier surface topography led to a strong valley-center flow component
Table 9.3 Glacier velocities at two areas (LTS, UTS) of the glacier tongue for both time periods
Area
Period
Measurements [n]
Mean
[m a
À1
]
Minimum
[m a
À1
]
Maximum
[m a
À1
]
LTS (Fig. 9.3) 2003–2006
–
2.3
0.6
5.4
2006–2009
–
2.2
0.7
4.9
Difference in %
À4.3
UTS (Fig. 9.4) 2003–2006
172
20.7
7.3
30.4
2006–2009
263
14.3
3.3
23.9
Difference in %
À30.9
The locations of LTS and UTS are indicated in Fig. 9.1, values given refer to the areas outlined in
Figs. 9.3 and 9.4
LTS: GSD of 0.25 m, correlation window 41 pixels  41 pixels
UTS: GSD of 2 m, correlation window 101 pixels  101 pixels
n number of measurements
188
V. Kaufmann et al.