

change. This figure reveals substantial elevation losses particularly at the glacier
tongue and even some elevation gains at the highest northeast-facing cirques.
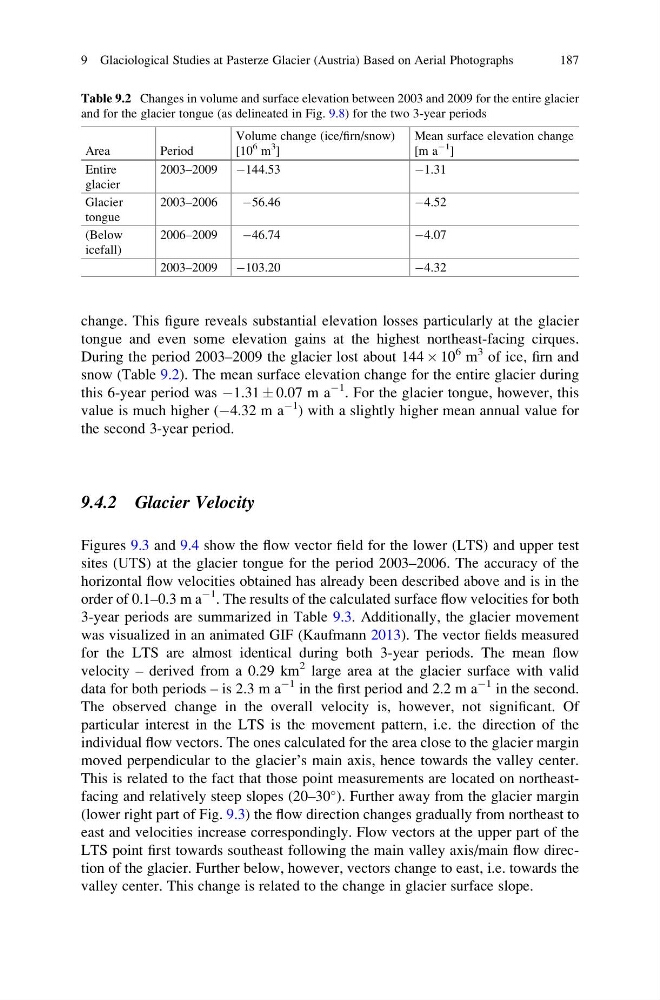
During the period 2003–2009 the glacier lost about 144 Â 10
6 m
3 of ice, firn and
snow (Table 9.2). The mean surface elevation change for the entire glacier during
this 6-year period was À1.31 Æ 0.07 m a
À1 . For the glacier tongue, however, this
value is much higher (À4.32 m a
À1
) with a slightly higher mean annual value for
the second 3-year period.
9.4.2 Glacier Velocity
Figures 9.3 and 9.4 show the flow vector field for the lower (LTS) and upper test
sites (UTS) at the glacier tongue for the period 2003–2006. The accuracy of the
horizontal flow velocities obtained has already been described above and is in the
order of 0.1–0.3 m a
À1 . The results of the calculated surface flow velocities for both
3-year periods are summarized in Table 9.3. Additionally, the glacier movement
was visualized in an animated GIF (Kaufmann 2013). The vector fields measured
for the LTS are almost identical during both 3-year periods. The mean flow
velocity – derived from a 0.29 km
2 large area at the glacier surface with valid
data for both periods – is 2.3 m a
À1 in the first period and 2.2 m a
À1 in the second.
The observed change in the overall velocity is, however, not significant. Of
particular interest in the LTS is the movement pattern, i.e. the direction of the
individual flow vectors. The ones calculated for the area close to the glacier margin
moved perpendicular to the glacier’s main axis, hence towards the valley center.
This is related to the fact that those point measurements are located on northeastfacing and relatively steep slopes (20–30
). Further away from the glacier margin
(lower right part of Fig. 9.3) the flow direction changes gradually from northeast to
east and velocities increase correspondingly. Flow vectors at the upper part of the
LTS point first towards southeast following the main valley axis/main flow direction of the glacier. Further below, however, vectors change to east, i.e. towards the
valley center. This change is related to the change in glacier surface slope.
Table 9.2 Changes in volume and surface elevation between 2003 and 2009 for the entire glacier
and for the glacier tongue (as delineated in Fig. 9.8) for the two 3-year periods
Area
Period
Volume change (ice/firn/snow)
[10
6 m
3
]
Mean surface elevation change
[m a
À1
]
Entire
glacier
2003–2009 À144.53
À1.31
Glacier
tongue
2003–2006
À56.46
À4.52
(Below
icefall)
2006–2009
À46.74
À4.07
2003–2009 À103.20
À4.32
9 Glaciological Studies at Pasterze Glacier (Austria) Based on Aerial Photographs
187
tongue and even some elevation gains at the highest northeast-facing cirques.
During the period 2003–2009 the glacier lost about 144 Â 10
6 m
3 of ice, firn and
snow (Table 9.2). The mean surface elevation change for the entire glacier during
this 6-year period was À1.31 Æ 0.07 m a
À1 . For the glacier tongue, however, this
value is much higher (À4.32 m a
À1
) with a slightly higher mean annual value for
the second 3-year period.
9.4.2 Glacier Velocity
Figures 9.3 and 9.4 show the flow vector field for the lower (LTS) and upper test
sites (UTS) at the glacier tongue for the period 2003–2006. The accuracy of the
horizontal flow velocities obtained has already been described above and is in the
order of 0.1–0.3 m a
À1 . The results of the calculated surface flow velocities for both
3-year periods are summarized in Table 9.3. Additionally, the glacier movement
was visualized in an animated GIF (Kaufmann 2013). The vector fields measured
for the LTS are almost identical during both 3-year periods. The mean flow
velocity – derived from a 0.29 km
2 large area at the glacier surface with valid
data for both periods – is 2.3 m a
À1 in the first period and 2.2 m a
À1 in the second.
The observed change in the overall velocity is, however, not significant. Of
particular interest in the LTS is the movement pattern, i.e. the direction of the
individual flow vectors. The ones calculated for the area close to the glacier margin
moved perpendicular to the glacier’s main axis, hence towards the valley center.
This is related to the fact that those point measurements are located on northeastfacing and relatively steep slopes (20–30
). Further away from the glacier margin
(lower right part of Fig. 9.3) the flow direction changes gradually from northeast to
east and velocities increase correspondingly. Flow vectors at the upper part of the
LTS point first towards southeast following the main valley axis/main flow direction of the glacier. Further below, however, vectors change to east, i.e. towards the
valley center. This change is related to the change in glacier surface slope.
Table 9.2 Changes in volume and surface elevation between 2003 and 2009 for the entire glacier
and for the glacier tongue (as delineated in Fig. 9.8) for the two 3-year periods
Area
Period
Volume change (ice/firn/snow)
[10
6 m
3
]
Mean surface elevation change
[m a
À1
]
Entire
glacier
2003–2009 À144.53
À1.31
Glacier
tongue
2003–2006
À56.46
À4.52
(Below
icefall)
2006–2009
À46.74
À4.07
2003–2009 À103.20
À4.32
9 Glaciological Studies at Pasterze Glacier (Austria) Based on Aerial Photographs
187