

58
Synthetic Aperture Radar (SAR)
Overview of SAR
SAR is an active instrument that sends pulses in the microwave region of the electromagnetic spectrum and records the return. The returns are processed in such a
way that the movement of the instrument is used to synthesise a larger antenna than
would others be physically impossible, which allows a high spatial resolution image
to be produced. Forming a SAR image from the raw data is normally carried out by
the data provider. The most common product from a SAR is an image of normalised
radar cross section or ‘backscatter’ (σ
0
), which is unitless. Partly because of the
large range of values, σ
0
is normally expressed on a log scale in decibels (dB).
However, depending on the mode and specification of the instrument, other products such as polarimetric decompositions (e.g., Pauli Decomposition; Krogager
1990) can also be generated. Where multiple acquisitions from different geometries
are available (i.e., multiple satellite passes), products such as the coherence (Gaveau
et al. 2003) and 3D structural information can also be derived (e.g., Ho Tong Minh
et al. 2016). However, within this Chapter, just the considerations of the backscatter
intensity and SAR, in general, will be discussed. For a full introduction to SAR
imagery and processing, refer to Woodhouse (2005).
The intensity of σ
0
is dependent on the vertical structure (i.e., buildings and vegetation) and moisture (predominantly soil). As the size of the vertical structure
increases, the magnitude of the SAR backscatter increases. For example, within a
forest, pixels of higher backscatter will typical correspond with areas of larger trees.
However, the background soil and vegetation moisture can also influence the signal.
For example, Lucas et al. (2010) demonstrated that in dry regions of Australia, rain
events can increase the SAR backscatter and therefore recommended the use of the
driest scenes available when generating regional mosaics. These were identified
through reference to spatial interpolations of rainfall measurements or low resolution, high-frequency AMSR-E passive microwave radiometer measures of surface
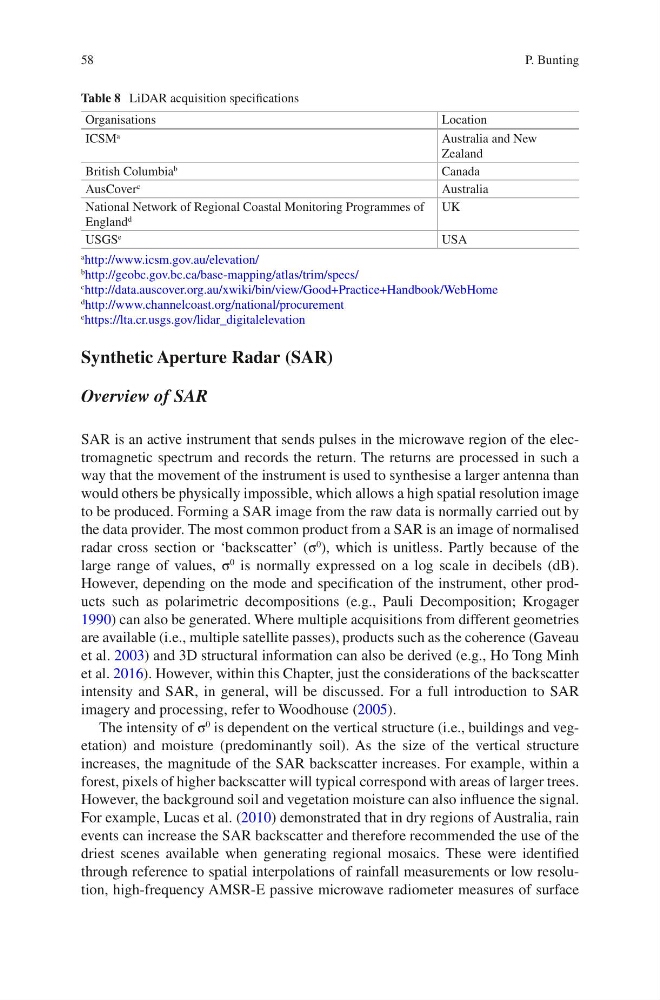
Table 8 LiDAR acquisition specifications
Organisations
Location
ICSM
a
Australia and New
Zealand
British Columbia
b
Canada
AusCover
c
Australia
National Network of Regional Coastal Monitoring Programmes of
England
d
UK
USGS
e
USA
a
http://www.icsm.gov.au/elevation/
b
http://geobc.gov.bc.ca/base-mapping/atlas/trim/specs/
c
http://data.auscover.org.au/xwiki/bin/view/Good+Practice+Handbook/WebHome
d
http://www.channelcoast.org/national/procurement
e
https://lta.cr.usgs.gov/lidar_digitalelevation
P. Bunting
Synthetic Aperture Radar (SAR)
Overview of SAR
SAR is an active instrument that sends pulses in the microwave region of the electromagnetic spectrum and records the return. The returns are processed in such a
way that the movement of the instrument is used to synthesise a larger antenna than
would others be physically impossible, which allows a high spatial resolution image
to be produced. Forming a SAR image from the raw data is normally carried out by
the data provider. The most common product from a SAR is an image of normalised
radar cross section or ‘backscatter’ (σ
0
), which is unitless. Partly because of the
large range of values, σ
0
is normally expressed on a log scale in decibels (dB).
However, depending on the mode and specification of the instrument, other products such as polarimetric decompositions (e.g., Pauli Decomposition; Krogager
1990) can also be generated. Where multiple acquisitions from different geometries
are available (i.e., multiple satellite passes), products such as the coherence (Gaveau
et al. 2003) and 3D structural information can also be derived (e.g., Ho Tong Minh
et al. 2016). However, within this Chapter, just the considerations of the backscatter
intensity and SAR, in general, will be discussed. For a full introduction to SAR
imagery and processing, refer to Woodhouse (2005).
The intensity of σ
0
is dependent on the vertical structure (i.e., buildings and vegetation) and moisture (predominantly soil). As the size of the vertical structure
increases, the magnitude of the SAR backscatter increases. For example, within a
forest, pixels of higher backscatter will typical correspond with areas of larger trees.
However, the background soil and vegetation moisture can also influence the signal.
For example, Lucas et al. (2010) demonstrated that in dry regions of Australia, rain
events can increase the SAR backscatter and therefore recommended the use of the
driest scenes available when generating regional mosaics. These were identified
through reference to spatial interpolations of rainfall measurements or low resolution, high-frequency AMSR-E passive microwave radiometer measures of surface
Table 8 LiDAR acquisition specifications
Organisations
Location
ICSM
a
Australia and New
Zealand
British Columbia
b
Canada
AusCover
c
Australia
National Network of Regional Coastal Monitoring Programmes of
England
d
UK
USGS
e
USA
a
http://www.icsm.gov.au/elevation/
b
http://geobc.gov.bc.ca/base-mapping/atlas/trim/specs/
c
http://data.auscover.org.au/xwiki/bin/view/Good+Practice+Handbook/WebHome
d
http://www.channelcoast.org/national/procurement
e
https://lta.cr.usgs.gov/lidar_digitalelevation
P. Bunting