

175
signature and 3 bands showing the ground signature where they do not perfectly
overlap in the mosaic. This signature therefore is not representative of the spectral
signature of the plant species. To achieve a more accurate signature for any plant
species in the composite mosaic, an average signature across a number of pixels is
taken and the mean signature used in classifications. To reduce the likelihood of
incorrect pixel signatures being attributed to a species in the signature editor, a spectral checkerboard was created.
The spectral checkerboard was built by taking 100 pixel samples (0.78 m/pixel)
from areas of accurate overlap, away from edges and for every target species in the
mosaics. Accurate overlap was defined where positive Digital Numbers (DNs) for
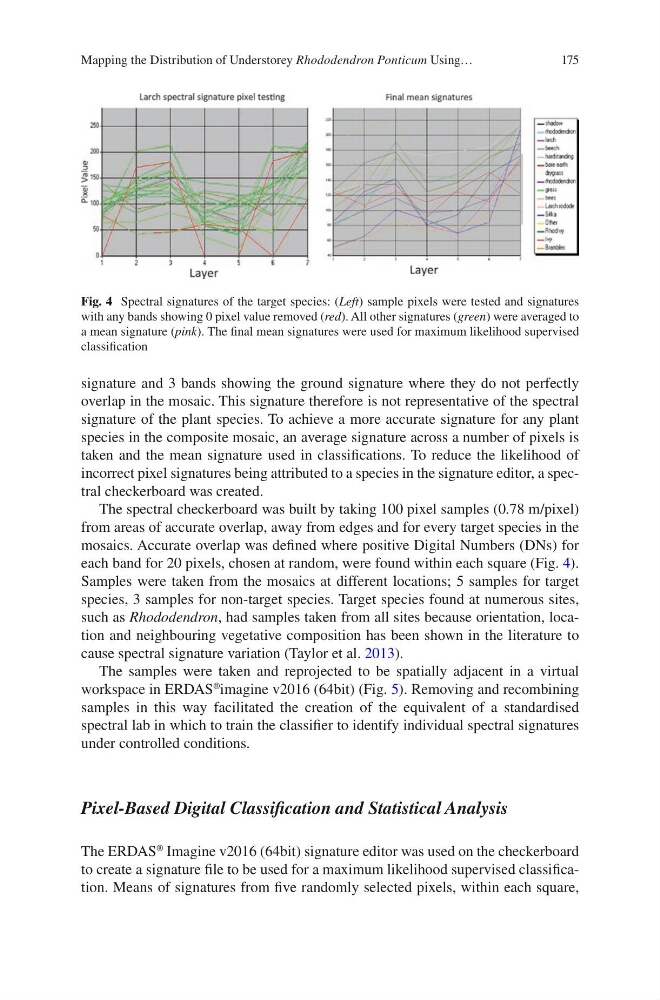
each band for 20 pixels, chosen at random, were found within each square (Fig. 4).
Samples were taken from the mosaics at different locations; 5 samples for target
species, 3 samples for non-target species. Target species found at numerous sites,
such as Rhododendron, had samples taken from all sites because orientation, location and neighbouring vegetative composition has been shown in the literature to
cause spectral signature variation (Taylor et al. 2013).
The samples were taken and reprojected to be spatially adjacent in a virtual
workspace in ERDAS
®
imagine v2016 (64bit) (Fig. 5). Removing and recombining
samples in this way facilitated the creation of the equivalent of a standardised
spectral lab in which to train the classifier to identify individual spectral signatures
under controlled conditions.
Pixel-Based Digital Classification and Statistical Analysis
The ERDAS
®
Imagine v2016 (64bit) signature editor was used on the checkerboard
to create a signature file to be used for a maximum likelihood supervised classification. Means of signatures from five randomly selected pixels, within each square,
Fig. 4 Spectral signatures of the target species: (Left) sample pixels were tested and signatures
with any bands showing 0 pixel value removed (red). All other signatures (green) were averaged to
a mean signature (pink). The final mean signatures were used for maximum likelihood supervised
classification
Mapping the Distribution of Understorey Rhododendron Ponticum Using…
signature and 3 bands showing the ground signature where they do not perfectly
overlap in the mosaic. This signature therefore is not representative of the spectral
signature of the plant species. To achieve a more accurate signature for any plant
species in the composite mosaic, an average signature across a number of pixels is
taken and the mean signature used in classifications. To reduce the likelihood of
incorrect pixel signatures being attributed to a species in the signature editor, a spectral checkerboard was created.
The spectral checkerboard was built by taking 100 pixel samples (0.78 m/pixel)
from areas of accurate overlap, away from edges and for every target species in the
mosaics. Accurate overlap was defined where positive Digital Numbers (DNs) for
each band for 20 pixels, chosen at random, were found within each square (Fig. 4).
Samples were taken from the mosaics at different locations; 5 samples for target
species, 3 samples for non-target species. Target species found at numerous sites,
such as Rhododendron, had samples taken from all sites because orientation, location and neighbouring vegetative composition has been shown in the literature to
cause spectral signature variation (Taylor et al. 2013).
The samples were taken and reprojected to be spatially adjacent in a virtual
workspace in ERDAS
®
imagine v2016 (64bit) (Fig. 5). Removing and recombining
samples in this way facilitated the creation of the equivalent of a standardised
spectral lab in which to train the classifier to identify individual spectral signatures
under controlled conditions.
Pixel-Based Digital Classification and Statistical Analysis
The ERDAS
®
Imagine v2016 (64bit) signature editor was used on the checkerboard
to create a signature file to be used for a maximum likelihood supervised classification. Means of signatures from five randomly selected pixels, within each square,
Fig. 4 Spectral signatures of the target species: (Left) sample pixels were tested and signatures
with any bands showing 0 pixel value removed (red). All other signatures (green) were averaged to
a mean signature (pink). The final mean signatures were used for maximum likelihood supervised
classification
Mapping the Distribution of Understorey Rhododendron Ponticum Using…