

129
habitats requires the inclusion of higher resolution (more detailed) imagery especially when considering sub-regional and site scales (Bell et al. 2015). The complete
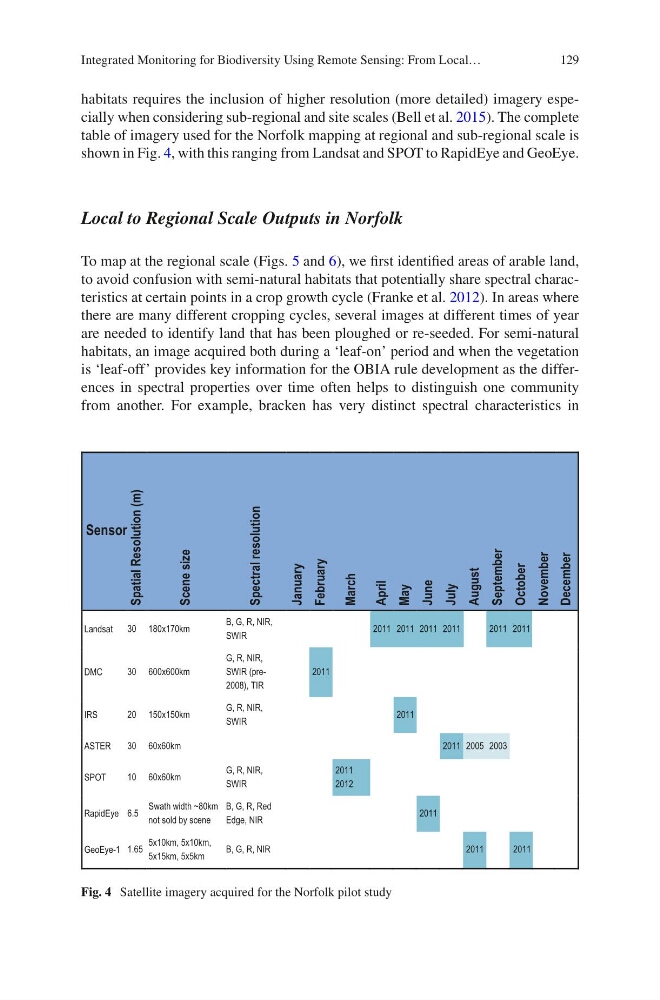
table of imagery used for the Norfolk mapping at regional and sub-regional scale is
shown in Fig. 4, with this ranging from Landsat and SPOT to RapidEye and GeoEye.
Local to Regional Scale Outputs in Norfolk
To map at the regional scale (Figs. 5 and 6), we first identified areas of arable land,
to avoid confusion with semi-natural habitats that potentially share spectral characteristics at certain points in a crop growth cycle (Franke et al. 2012). In areas where
there are many different cropping cycles, several images at different times of year
are needed to identify land that has been ploughed or re-seeded. For semi-natural
habitats, an image acquired both during a ‘leaf-on’ period and when the vegetation
is ‘leaf-off’ provides key information for the OBIA rule development as the differences in spectral properties over time often helps to distinguish one community
from another. For example, bracken has very distinct spectral characteristics in
Sensor
Spatial Resolution (m)
Scene size
Spectral resolution
January
February
March
April
May
June
July
August
September
October
November
December
Landsat
30 180x170km
B, G, R, NIR,
SWIR
2011 2011 2011 2011
2011 2011
DMC
30 600x600km
G, R, NIR,
SWIR (pre2008), TIR
2011
IRS
20 150x150km
G, R, NIR,
SWIR
2011
ASTER
30 60x60km
2011 2005 2003
SPOT
10 60x60km
G, R, NIR,
SWIR
2011
2012
RapidEye 6.5
Swath width ~80km
not sold by scene
B, G, R, Red
Edge, NIR
2011
GeoEye-1 1.65
5x10km, 5x10km,
5x15km, 5x5km
B, G, R, NIR
2011
2011
Fig. 4 Satellite imagery acquired for the Norfolk pilot study
Integrated Monitoring for Biodiversity Using Remote Sensing: From Local…
habitats requires the inclusion of higher resolution (more detailed) imagery especially when considering sub-regional and site scales (Bell et al. 2015). The complete
table of imagery used for the Norfolk mapping at regional and sub-regional scale is
shown in Fig. 4, with this ranging from Landsat and SPOT to RapidEye and GeoEye.
Local to Regional Scale Outputs in Norfolk
To map at the regional scale (Figs. 5 and 6), we first identified areas of arable land,
to avoid confusion with semi-natural habitats that potentially share spectral characteristics at certain points in a crop growth cycle (Franke et al. 2012). In areas where
there are many different cropping cycles, several images at different times of year
are needed to identify land that has been ploughed or re-seeded. For semi-natural
habitats, an image acquired both during a ‘leaf-on’ period and when the vegetation
is ‘leaf-off’ provides key information for the OBIA rule development as the differences in spectral properties over time often helps to distinguish one community
from another. For example, bracken has very distinct spectral characteristics in
Sensor
Spatial Resolution (m)
Scene size
Spectral resolution
January
February
March
April
May
June
July
August
September
October
November
December
Landsat
30 180x170km
B, G, R, NIR,
SWIR
2011 2011 2011 2011
2011 2011
DMC
30 600x600km
G, R, NIR,
SWIR (pre2008), TIR
2011
IRS
20 150x150km
G, R, NIR,
SWIR
2011
ASTER
30 60x60km
2011 2005 2003
SPOT
10 60x60km
G, R, NIR,
SWIR
2011
2012
RapidEye 6.5
Swath width ~80km
not sold by scene
B, G, R, Red
Edge, NIR
2011
GeoEye-1 1.65
5x10km, 5x10km,
5x15km, 5x5km
B, G, R, NIR
2011
2011
Fig. 4 Satellite imagery acquired for the Norfolk pilot study
Integrated Monitoring for Biodiversity Using Remote Sensing: From Local…