

105
Detailed Habitat Mapping
For the next stage of mapping, machine learning algorithms were used. Fig. 7 shows
the method used to calculate multiple layers for each habitat class. This is necessary
to test which algorithm would be most suitable, which input features are the most
significant and which layer shows the highest correspondence with actual spatial
distributions of classes in the field.
Algorithm Selection
Table 2 provides brief descriptions of algorithms tested before a selection of the best
performing were chosen for further classification. An open source python library
called scikit-learn was utilised to perform all classifications and for more information on calculating these algorithms see (Scikit-learn website 2016).
The algorithms that were finally selected were all nonparametric, as there is a
known bias in the training dataset caused by the presence of sparse or rare habitats
and a lack of representative point data in those classes. Reasons to not adopt algorithms for further analysis include overestimation of some classes leading to others
not being classified, which is to be expected with assumptions of Gaussian distributions that are not present in the data. The chosen algorithms were mainly ensemble
classifiers as they produce higher accuracies and are particularly more robust than,
for example, the decision tree algorithm. Also, a group of classifiers has been found
to perform more accurately than any single classifier (Ghimire et al. 2006). The support vector machine (SVM) also proved robust, although the selection of parameters
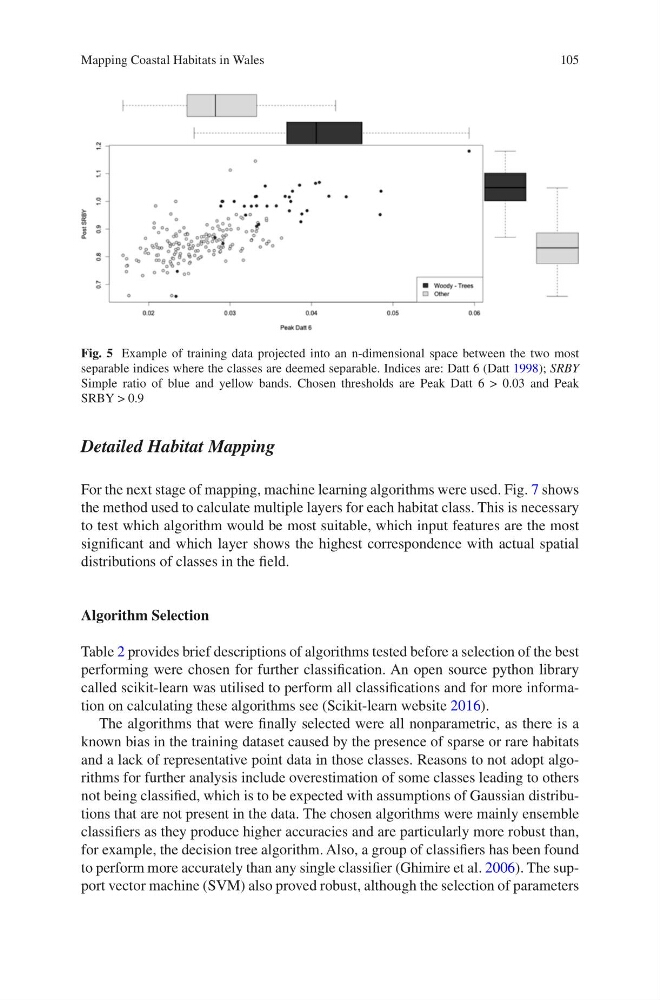
Fig. 5 Example of training data projected into an n-dimensional space between the two most
separable indices where the classes are deemed separable. Indices are: Datt 6 (Datt 1998); SRBY
Simple ratio of blue and yellow bands. Chosen thresholds are Peak Datt 6 > 0.03 and Peak
SRBY > 0.9
Mapping Coastal Habitats in Wales
Detailed Habitat Mapping
For the next stage of mapping, machine learning algorithms were used. Fig. 7 shows
the method used to calculate multiple layers for each habitat class. This is necessary
to test which algorithm would be most suitable, which input features are the most
significant and which layer shows the highest correspondence with actual spatial
distributions of classes in the field.
Algorithm Selection
Table 2 provides brief descriptions of algorithms tested before a selection of the best
performing were chosen for further classification. An open source python library
called scikit-learn was utilised to perform all classifications and for more information on calculating these algorithms see (Scikit-learn website 2016).
The algorithms that were finally selected were all nonparametric, as there is a
known bias in the training dataset caused by the presence of sparse or rare habitats
and a lack of representative point data in those classes. Reasons to not adopt algorithms for further analysis include overestimation of some classes leading to others
not being classified, which is to be expected with assumptions of Gaussian distributions that are not present in the data. The chosen algorithms were mainly ensemble
classifiers as they produce higher accuracies and are particularly more robust than,
for example, the decision tree algorithm. Also, a group of classifiers has been found
to perform more accurately than any single classifier (Ghimire et al. 2006). The support vector machine (SVM) also proved robust, although the selection of parameters
Fig. 5 Example of training data projected into an n-dimensional space between the two most
separable indices where the classes are deemed separable. Indices are: Datt 6 (Datt 1998); SRBY
Simple ratio of blue and yellow bands. Chosen thresholds are Peak Datt 6 > 0.03 and Peak
SRBY > 0.9
Mapping Coastal Habitats in Wales