

264
Stefano Burigat and Luca Chittaro
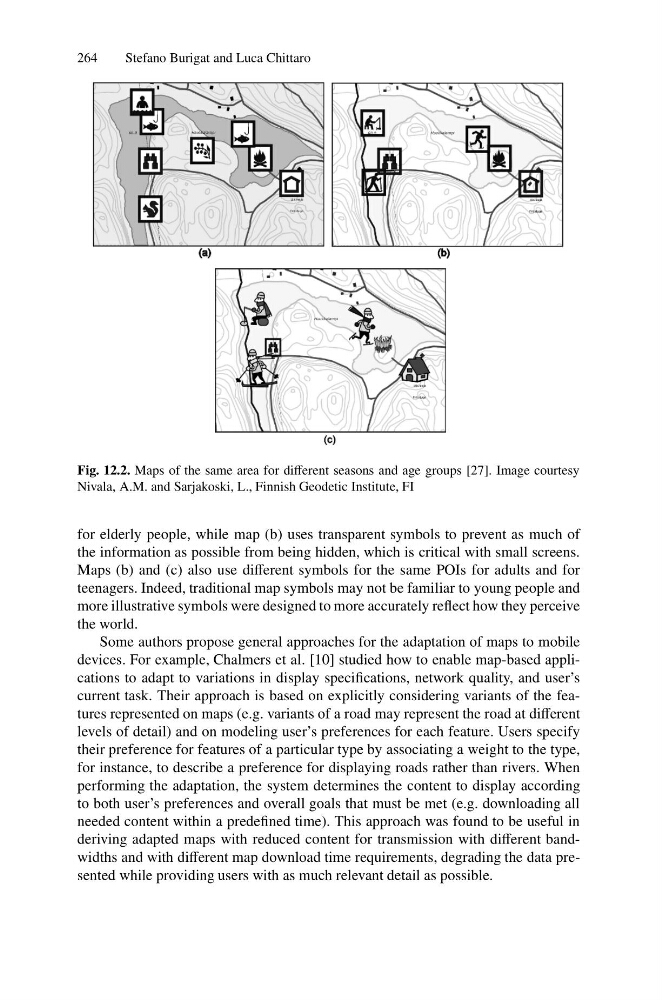
Fig. 12.2. Maps of the same area for different seasons and age groups [27]. Image courtesy
Nivala, A.M. and Sarjakoski, L., Finnish Geodetic Institute, FI
for elderly people, while map (b) uses transparent symbols to prevent as much of
the information as possible from being hidden, which is critical with small screens.
Maps (b) and (c) also use different symbols for the same POIs for adults and for
teenagers. Indeed, traditional map symbols may not be familiar to young people and
more illustrative symbols were designed to more accurately reflect how they perceive
the world.
Some authors propose general approaches for the adaptation of maps to mobile
devices. For example, Chalmers et al. [10] studied how to enable map-based applications to adapt to variations in display specifications, network quality, and user’s
current task. Their approach is based on explicitly considering variants of the features represented on maps (e.g. variants of a road may represent the road at different
levels of detail) and on modeling user’s preferences for each feature. Users specify
their preference for features of a particular type by associating a weight to the type,
for instance, to describe a preference for displaying roads rather than rivers. When
performing the adaptation, the system determines the content to display according
to both user’s preferences and overall goals that must be met (e.g. downloading all
needed content within a predefined time). This approach was found to be useful in
deriving adapted maps with reduced content for transmission with different bandwidths and with different map download time requirements, degrading the data presented while providing users with as much relevant detail as possible.
Stefano Burigat and Luca Chittaro
Fig. 12.2. Maps of the same area for different seasons and age groups [27]. Image courtesy
Nivala, A.M. and Sarjakoski, L., Finnish Geodetic Institute, FI
for elderly people, while map (b) uses transparent symbols to prevent as much of
the information as possible from being hidden, which is critical with small screens.
Maps (b) and (c) also use different symbols for the same POIs for adults and for
teenagers. Indeed, traditional map symbols may not be familiar to young people and
more illustrative symbols were designed to more accurately reflect how they perceive
the world.
Some authors propose general approaches for the adaptation of maps to mobile
devices. For example, Chalmers et al. [10] studied how to enable map-based applications to adapt to variations in display specifications, network quality, and user’s
current task. Their approach is based on explicitly considering variants of the features represented on maps (e.g. variants of a road may represent the road at different
levels of detail) and on modeling user’s preferences for each feature. Users specify
their preference for features of a particular type by associating a weight to the type,
for instance, to describe a preference for displaying roads rather than rivers. When
performing the adaptation, the system determines the content to display according
to both user’s preferences and overall goals that must be met (e.g. downloading all
needed content within a predefined time). This approach was found to be useful in
deriving adapted maps with reduced content for transmission with different bandwidths and with different map download time requirements, degrading the data presented while providing users with as much relevant detail as possible.