

Comparison with other analytical solutions: In this case, it is assumed that the
researcher agrees with the theory behind the analytical formulation and with the
same mathematical approach, as it also can be used for model verification. If this
numeric code fails at playing an analytical solution, there must be a problem with
the model formulation (Freedman and Ibaraki 2003).
Comparison with experimental results: This type of validation is the best,
because it shows the consistency of the model with reality. However, obtained
results of experiments are usually very complex and can be errors if not taken into
account a correct consideration of environmental conditions. There is a risk that
the model only works for a particular case and is not able to predict for another
similar situation, or that the results do not accurately represent reality.
2.4.2 Statistical Tools
There are many statistical tools for model validation, but the primary tool for most
process modeling applications is graphical residual analysis. These statistics can
be classified in two categories:
(a) Differences between the predictions and the measurements.
(b) Correlation between the model outputs and the measurements from the system.
Deviation-based statistics has often used with correlation-based statistics.
Although these different statistics may represent different aspects of the model
measurement discrepancy, the deviation-based statistics (e.g., root mean square of
deviation) and the correlation-based statistics (e.g., correlation coefficient) are not
really with each other in their assumptions.
The residuals from a fitted model are the differences between the responses
observed at each combination values of the explanatory variables and the corresponding predictions of the response computed using the model. Respectively,
these values can be standardized by subtracting the mean and dividing by the
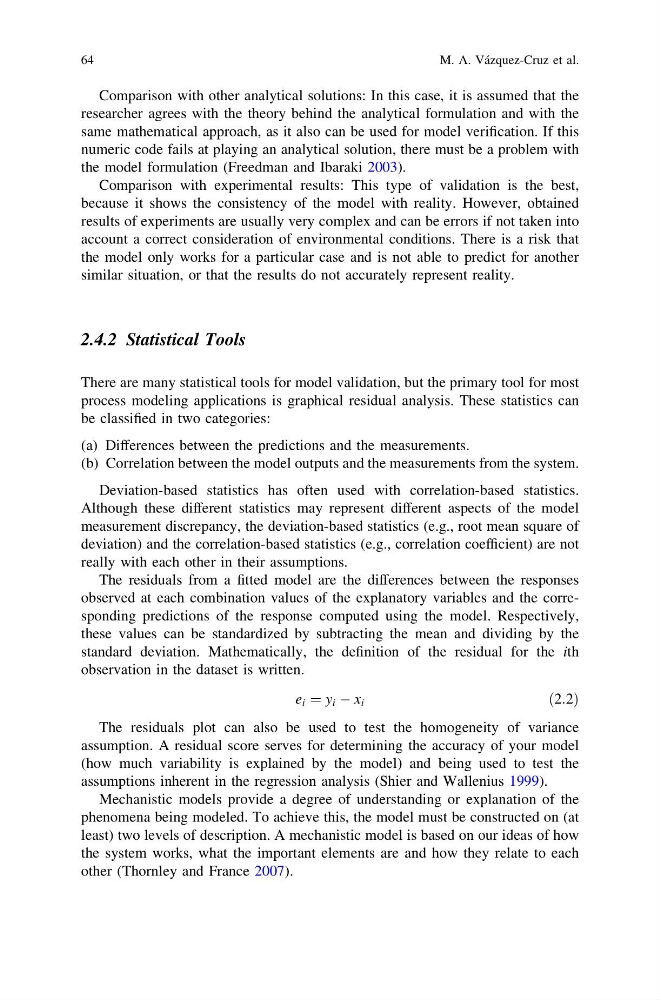
standard deviation. Mathematically, the definition of the residual for the ith
observation in the dataset is written.
e i ¼ y i À x i
ð2:2Þ
The residuals plot can also be used to test the homogeneity of variance
assumption. A residual score serves for determining the accuracy of your model
(how much variability is explained by the model) and being used to test the
assumptions inherent in the regression analysis (Shier and Wallenius 1999).
Mechanistic models provide a degree of understanding or explanation of the
phenomena being modeled. To achieve this, the model must be constructed on (at
least) two levels of description. A mechanistic model is based on our ideas of how
the system works, what the important elements are and how they relate to each
other (Thornley and France 2007).
64
M. A. Vázquez-Cruz et al.
researcher agrees with the theory behind the analytical formulation and with the
same mathematical approach, as it also can be used for model verification. If this
numeric code fails at playing an analytical solution, there must be a problem with
the model formulation (Freedman and Ibaraki 2003).
Comparison with experimental results: This type of validation is the best,
because it shows the consistency of the model with reality. However, obtained
results of experiments are usually very complex and can be errors if not taken into
account a correct consideration of environmental conditions. There is a risk that
the model only works for a particular case and is not able to predict for another
similar situation, or that the results do not accurately represent reality.
2.4.2 Statistical Tools
There are many statistical tools for model validation, but the primary tool for most
process modeling applications is graphical residual analysis. These statistics can
be classified in two categories:
(a) Differences between the predictions and the measurements.
(b) Correlation between the model outputs and the measurements from the system.
Deviation-based statistics has often used with correlation-based statistics.
Although these different statistics may represent different aspects of the model
measurement discrepancy, the deviation-based statistics (e.g., root mean square of
deviation) and the correlation-based statistics (e.g., correlation coefficient) are not
really with each other in their assumptions.
The residuals from a fitted model are the differences between the responses
observed at each combination values of the explanatory variables and the corresponding predictions of the response computed using the model. Respectively,
these values can be standardized by subtracting the mean and dividing by the
standard deviation. Mathematically, the definition of the residual for the ith
observation in the dataset is written.
e i ¼ y i À x i
ð2:2Þ
The residuals plot can also be used to test the homogeneity of variance
assumption. A residual score serves for determining the accuracy of your model
(how much variability is explained by the model) and being used to test the
assumptions inherent in the regression analysis (Shier and Wallenius 1999).
Mechanistic models provide a degree of understanding or explanation of the
phenomena being modeled. To achieve this, the model must be constructed on (at
least) two levels of description. A mechanistic model is based on our ideas of how
the system works, what the important elements are and how they relate to each
other (Thornley and France 2007).
64
M. A. Vázquez-Cruz et al.