

50
J. Gower and S. King
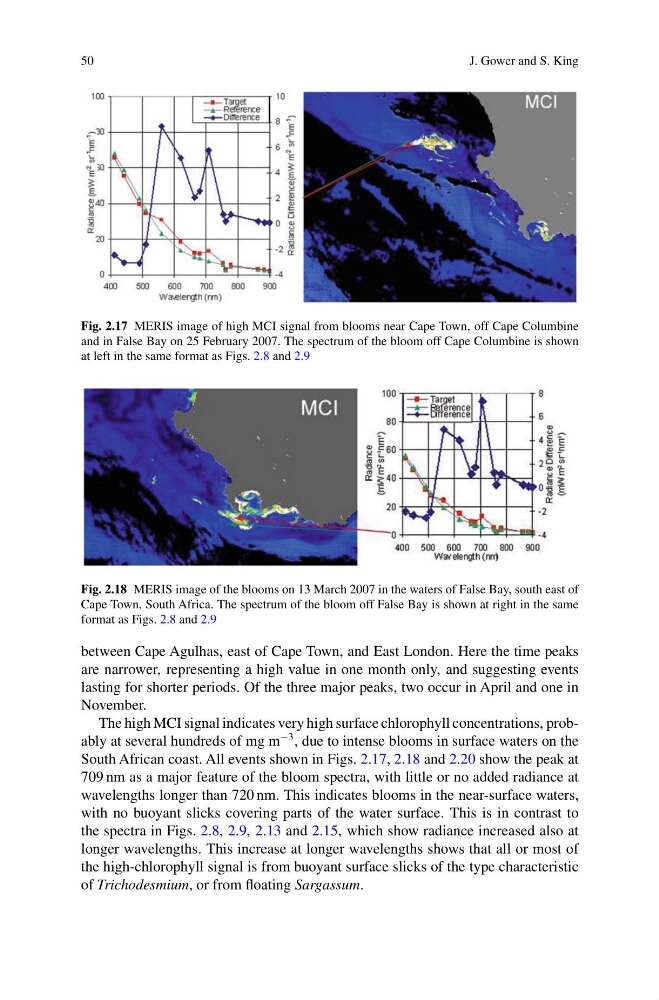
Fig. 2.17 MERIS image of high MCI signal from blooms near Cape Town, off Cape Columbine
and in False Bay on 25 February 2007. The spectrum of the bloom off Cape Columbine is shown
at left in the same format as Figs. 2.8 and 2.9
Fig. 2.18 MERIS image of the blooms on 13 March 2007 in the waters of False Bay, south east of
Cape Town, South Africa. The spectrum of the bloom off False Bay is shown at right in the same
format as Figs. 2.8 and 2.9
between Cape Agulhas, east of Cape Town, and East London. Here the time peaks
are narrower, representing a high value in one month only, and suggesting events
lasting for shorter periods. Of the three major peaks, two occur in April and one in
November.
The high MCI signal indicates very high surface chlorophyll concentrations, probably at several hundreds of mg m
−3 , due to intense blooms in surface waters on the
South African coast. All events shown in Figs. 2.17, 2.18 and 2.20 show the peak at
709 nm as a major feature of the bloom spectra, with little or no added radiance at
wavelengths longer than 720 nm. This indicates blooms in the near-surface waters,
with no buoyant slicks covering parts of the water surface. This is in contrast to
the spectra in Figs. 2.8, 2.9, 2.13 and 2.15, which show radiance increased also at
longer wavelengths. This increase at longer wavelengths shows that all or most of
the high-chlorophyll signal is from buoyant surface slicks of the type characteristic
of Trichodesmium, or from floating Sargassum.
J. Gower and S. King
Fig. 2.17 MERIS image of high MCI signal from blooms near Cape Town, off Cape Columbine
and in False Bay on 25 February 2007. The spectrum of the bloom off Cape Columbine is shown
at left in the same format as Figs. 2.8 and 2.9
Fig. 2.18 MERIS image of the blooms on 13 March 2007 in the waters of False Bay, south east of
Cape Town, South Africa. The spectrum of the bloom off False Bay is shown at right in the same
format as Figs. 2.8 and 2.9
between Cape Agulhas, east of Cape Town, and East London. Here the time peaks
are narrower, representing a high value in one month only, and suggesting events
lasting for shorter periods. Of the three major peaks, two occur in April and one in
November.
The high MCI signal indicates very high surface chlorophyll concentrations, probably at several hundreds of mg m
−3 , due to intense blooms in surface waters on the
South African coast. All events shown in Figs. 2.17, 2.18 and 2.20 show the peak at
709 nm as a major feature of the bloom spectra, with little or no added radiance at
wavelengths longer than 720 nm. This indicates blooms in the near-surface waters,
with no buoyant slicks covering parts of the water surface. This is in contrast to
the spectra in Figs. 2.8, 2.9, 2.13 and 2.15, which show radiance increased also at
longer wavelengths. This increase at longer wavelengths shows that all or most of
the high-chlorophyll signal is from buoyant surface slicks of the type characteristic
of Trichodesmium, or from floating Sargassum.