

2 Satellite Water Colour Observations in African Seas
49
0
500
1000
1500
2000
2500
2002 2003 2004 2005 2006 2007 2008 2009 2010 2011 2012
Start of year
Total MCI signal
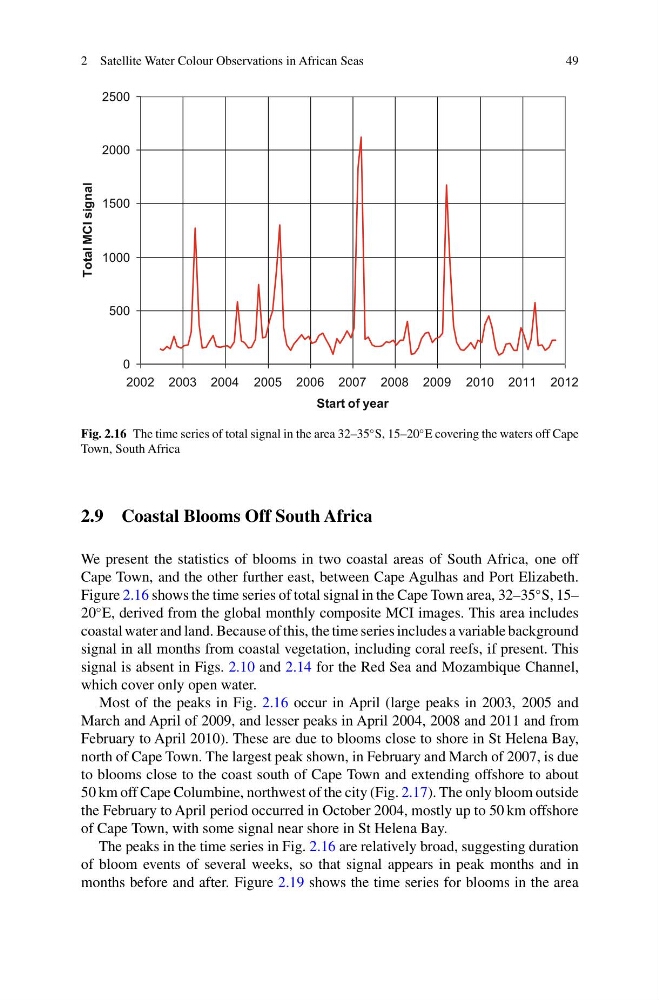
Fig. 2.16 The time series of total signal in the area 32–35
◦ S, 15–20
◦ E covering the waters off Cape
Town, South Africa
2.9 Coastal Blooms Off South Africa
We present the statistics of blooms in two coastal areas of South Africa, one off
Cape Town, and the other further east, between Cape Agulhas and Port Elizabeth.
Figure 2.16 shows the time series of total signal in the Cape Town area, 32–35
◦ S, 15–
20
◦ E, derived from the global monthly composite MCI images. This area includes
coastal water and land. Because of this, the time series includes a variable background
signal in all months from coastal vegetation, including coral reefs, if present. This
signal is absent in Figs. 2.10 and 2.14 for the Red Sea and Mozambique Channel,
which cover only open water.
Most of the peaks in Fig. 2.16 occur in April (large peaks in 2003, 2005 and
March and April of 2009, and lesser peaks in April 2004, 2008 and 2011 and from
February to April 2010). These are due to blooms close to shore in St Helena Bay,
north of Cape Town. The largest peak shown, in February and March of 2007, is due
to blooms close to the coast south of Cape Town and extending offshore to about
50 km off Cape Columbine, northwest of the city (Fig. 2.17). The only bloom outside
the February to April period occurred in October 2004, mostly up to 50 km offshore
of Cape Town, with some signal near shore in St Helena Bay.
The peaks in the time series in Fig. 2.16 are relatively broad, suggesting duration
of bloom events of several weeks, so that signal appears in peak months and in
months before and after. Figure 2.19 shows the time series for blooms in the area
49
0
500
1000
1500
2000
2500
2002 2003 2004 2005 2006 2007 2008 2009 2010 2011 2012
Start of year
Total MCI signal
Fig. 2.16 The time series of total signal in the area 32–35
◦ S, 15–20
◦ E covering the waters off Cape
Town, South Africa
2.9 Coastal Blooms Off South Africa
We present the statistics of blooms in two coastal areas of South Africa, one off
Cape Town, and the other further east, between Cape Agulhas and Port Elizabeth.
Figure 2.16 shows the time series of total signal in the Cape Town area, 32–35
◦ S, 15–
20
◦ E, derived from the global monthly composite MCI images. This area includes
coastal water and land. Because of this, the time series includes a variable background
signal in all months from coastal vegetation, including coral reefs, if present. This
signal is absent in Figs. 2.10 and 2.14 for the Red Sea and Mozambique Channel,
which cover only open water.
Most of the peaks in Fig. 2.16 occur in April (large peaks in 2003, 2005 and
March and April of 2009, and lesser peaks in April 2004, 2008 and 2011 and from
February to April 2010). These are due to blooms close to shore in St Helena Bay,
north of Cape Town. The largest peak shown, in February and March of 2007, is due
to blooms close to the coast south of Cape Town and extending offshore to about
50 km off Cape Columbine, northwest of the city (Fig. 2.17). The only bloom outside
the February to April period occurred in October 2004, mostly up to 50 km offshore
of Cape Town, with some signal near shore in St Helena Bay.
The peaks in the time series in Fig. 2.16 are relatively broad, suggesting duration
of bloom events of several weeks, so that signal appears in peak months and in
months before and after. Figure 2.19 shows the time series for blooms in the area