

2 Satellite Water Colour Observations in African Seas
37
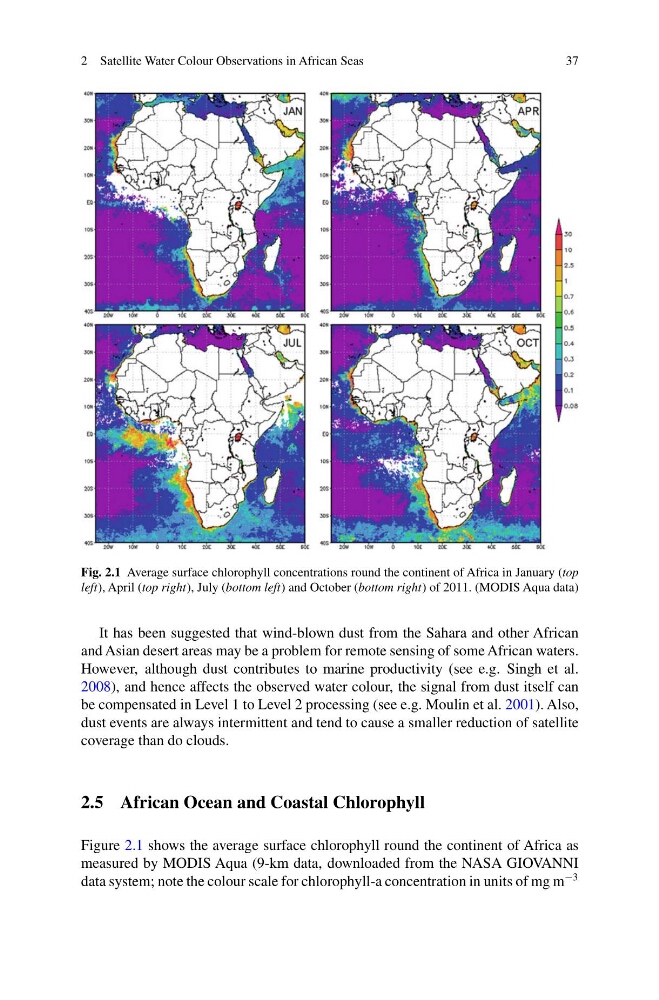
Fig. 2.1 Average surface chlorophyll concentrations round the continent of Africa in January (top
left), April (top right), July (bottom left) and October (bottom right) of 2011. (MODIS Aqua data)
It has been suggested that wind-blown dust from the Sahara and other African
and Asian desert areas may be a problem for remote sensing of some African waters.
However, although dust contributes to marine productivity (see e.g. Singh et al.
2008), and hence affects the observed water colour, the signal from dust itself can
be compensated in Level 1 to Level 2 processing (see e.g. Moulin et al. 2001). Also,
dust events are always intermittent and tend to cause a smaller reduction of satellite
coverage than do clouds.
2.5 African Ocean and Coastal Chlorophyll
Figure 2.1 shows the average surface chlorophyll round the continent of Africa as
measured by MODIS Aqua (9-km data, downloaded from the NASA GIOVANNI
data system; note the colour scale for chlorophyll-a concentration in units of mg m
−3
37
Fig. 2.1 Average surface chlorophyll concentrations round the continent of Africa in January (top
left), April (top right), July (bottom left) and October (bottom right) of 2011. (MODIS Aqua data)
It has been suggested that wind-blown dust from the Sahara and other African
and Asian desert areas may be a problem for remote sensing of some African waters.
However, although dust contributes to marine productivity (see e.g. Singh et al.
2008), and hence affects the observed water colour, the signal from dust itself can
be compensated in Level 1 to Level 2 processing (see e.g. Moulin et al. 2001). Also,
dust events are always intermittent and tend to cause a smaller reduction of satellite
coverage than do clouds.
2.5 African Ocean and Coastal Chlorophyll
Figure 2.1 shows the average surface chlorophyll round the continent of Africa as
measured by MODIS Aqua (9-km data, downloaded from the NASA GIOVANNI
data system; note the colour scale for chlorophyll-a concentration in units of mg m
−3