

36
J. Gower and S. King
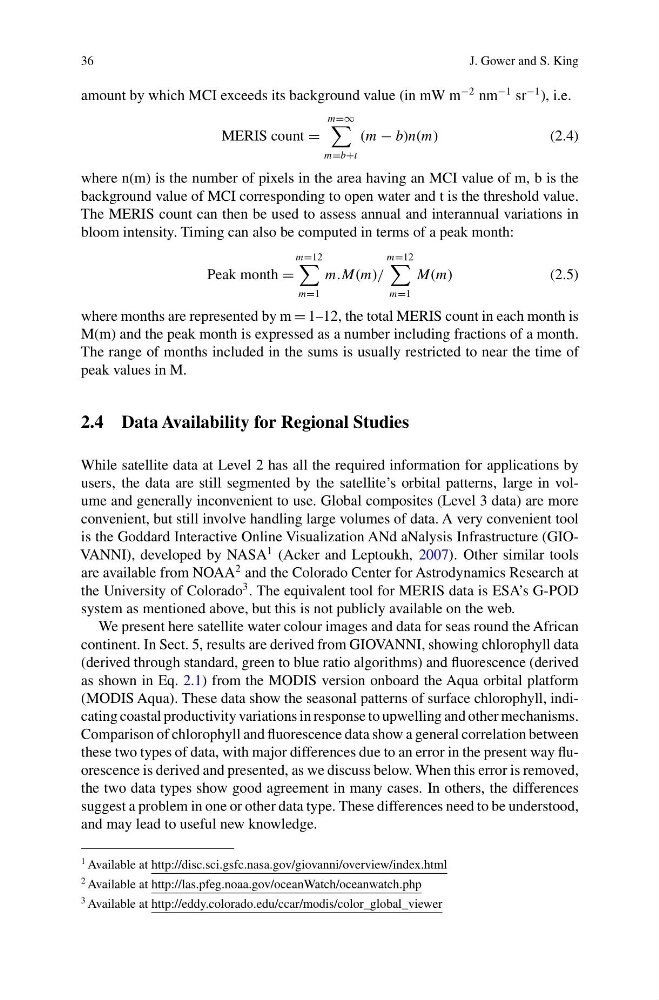
amount by which MCI exceeds its background value (in mW m
−2 nm
−1 sr
−1 ), i.e.
MERIS count =
m=∞
m=b+t
(m − b)n(m)
(2.4)
where n(m) is the number of pixels in the area having an MCI value of m, b is the
background value of MCI corresponding to open water and t is the threshold value.
The MERIS count can then be used to assess annual and interannual variations in
bloom intensity. Timing can also be computed in terms of a peak month:
Peak month =
m=12
m=1
m.M(m)/
m=12
m=1
M(m)
(2.5)
where months are represented by m = 1–12, the total MERIS count in each month is
M(m) and the peak month is expressed as a number including fractions of a month.
The range of months included in the sums is usually restricted to near the time of
peak values in M.
2.4 Data Availability for Regional Studies
While satellite data at Level 2 has all the required information for applications by
users, the data are still segmented by the satellite’s orbital patterns, large in volume and generally inconvenient to use. Global composites (Level 3 data) are more
convenient, but still involve handling large volumes of data. A very convenient tool
is the Goddard Interactive Online Visualization ANd aNalysis Infrastructure (GIOVANNI), developed by NASA
1 (Acker and Leptoukh, 2007). Other similar tools
are available from NOAA
2 and the Colorado Center for Astrodynamics Research at
the University of Colorado
3 . The equivalent tool for MERIS data is ESA’s G-POD
system as mentioned above, but this is not publicly available on the web.
We present here satellite water colour images and data for seas round the African
continent. In Sect. 5, results are derived from GIOVANNI, showing chlorophyll data
(derived through standard, green to blue ratio algorithms) and fluorescence (derived
as shown in Eq. 2.1) from the MODIS version onboard the Aqua orbital platform
(MODIS Aqua). These data show the seasonal patterns of surface chlorophyll, indicating coastal productivity variations in response to upwelling and other mechanisms.
Comparison of chlorophyll and fluorescence data show a general correlation between
these two types of data, with major differences due to an error in the present way fluorescence is derived and presented, as we discuss below. When this error is removed,
the two data types show good agreement in many cases. In others, the differences
suggest a problem in one or other data type. These differences need to be understood,
and may lead to useful new knowledge.
1 Available at http://disc.sci.gsfc.nasa.gov/giovanni/overview/index.html
2 Available at http://las.pfeg.noaa.gov/oceanWatch/oceanwatch.php
3 Available at http://eddy.colorado.edu/ccar/modis/color_global_viewer
J. Gower and S. King
amount by which MCI exceeds its background value (in mW m
−2 nm
−1 sr
−1 ), i.e.
MERIS count =
m=∞
m=b+t
(m − b)n(m)
(2.4)
where n(m) is the number of pixels in the area having an MCI value of m, b is the
background value of MCI corresponding to open water and t is the threshold value.
The MERIS count can then be used to assess annual and interannual variations in
bloom intensity. Timing can also be computed in terms of a peak month:
Peak month =
m=12
m=1
m.M(m)/
m=12
m=1
M(m)
(2.5)
where months are represented by m = 1–12, the total MERIS count in each month is
M(m) and the peak month is expressed as a number including fractions of a month.
The range of months included in the sums is usually restricted to near the time of
peak values in M.
2.4 Data Availability for Regional Studies
While satellite data at Level 2 has all the required information for applications by
users, the data are still segmented by the satellite’s orbital patterns, large in volume and generally inconvenient to use. Global composites (Level 3 data) are more
convenient, but still involve handling large volumes of data. A very convenient tool
is the Goddard Interactive Online Visualization ANd aNalysis Infrastructure (GIOVANNI), developed by NASA
1 (Acker and Leptoukh, 2007). Other similar tools
are available from NOAA
2 and the Colorado Center for Astrodynamics Research at
the University of Colorado
3 . The equivalent tool for MERIS data is ESA’s G-POD
system as mentioned above, but this is not publicly available on the web.
We present here satellite water colour images and data for seas round the African
continent. In Sect. 5, results are derived from GIOVANNI, showing chlorophyll data
(derived through standard, green to blue ratio algorithms) and fluorescence (derived
as shown in Eq. 2.1) from the MODIS version onboard the Aqua orbital platform
(MODIS Aqua). These data show the seasonal patterns of surface chlorophyll, indicating coastal productivity variations in response to upwelling and other mechanisms.
Comparison of chlorophyll and fluorescence data show a general correlation between
these two types of data, with major differences due to an error in the present way fluorescence is derived and presented, as we discuss below. When this error is removed,
the two data types show good agreement in many cases. In others, the differences
suggest a problem in one or other data type. These differences need to be understood,
and may lead to useful new knowledge.
1 Available at http://disc.sci.gsfc.nasa.gov/giovanni/overview/index.html
2 Available at http://las.pfeg.noaa.gov/oceanWatch/oceanwatch.php
3 Available at http://eddy.colorado.edu/ccar/modis/color_global_viewer