

19 Satellite Surveys of Lagoon and Coastal Waters . . .
397
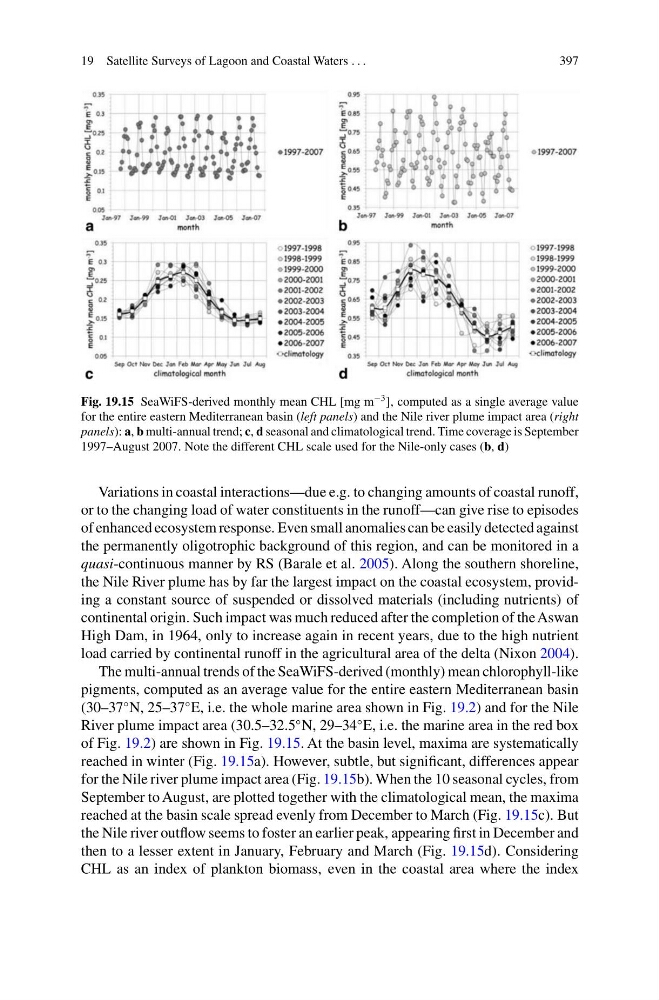
Fig. 19.15 SeaWiFS-derived monthly mean CHL [mg m
−3 ], computed as a single average value
for the entire eastern Mediterranean basin (left panels) and the Nile river plume impact area (right
panels): a, b multi-annual trend; c, d seasonal and climatological trend. Time coverage is September
1997–August 2007. Note the different CHL scale used for the Nile-only cases (b, d)
Variations in coastal interactions—due e.g. to changing amounts of coastal runoff,
or to the changing load of water constituents in the runoff—can give rise to episodes
of enhanced ecosystem response. Even small anomalies can be easily detected against
the permanently oligotrophic background of this region, and can be monitored in a
quasi-continuous manner by RS (Barale et al. 2005). Along the southern shoreline,
the Nile River plume has by far the largest impact on the coastal ecosystem, providing a constant source of suspended or dissolved materials (including nutrients) of
continental origin. Such impact was much reduced after the completion of the Aswan
High Dam, in 1964, only to increase again in recent years, due to the high nutrient
load carried by continental runoff in the agricultural area of the delta (Nixon 2004).
The multi-annual trends of the SeaWiFS-derived (monthly) mean chlorophyll-like
pigments, computed as an average value for the entire eastern Mediterranean basin
(30–37
◦ N, 25–37
◦ E, i.e. the whole marine area shown in Fig. 19.2) and for the Nile
River plume impact area (30.5–32.5
◦ N, 29–34
◦ E, i.e. the marine area in the red box
of Fig. 19.2) are shown in Fig. 19.15. At the basin level, maxima are systematically
reached in winter (Fig. 19.15a). However, subtle, but significant, differences appear
for the Nile river plume impact area (Fig. 19.15b). When the 10 seasonal cycles, from
September to August, are plotted together with the climatological mean, the maxima
reached at the basin scale spread evenly from December to March (Fig. 19.15c). But
the Nile river outflow seems to foster an earlier peak, appearing first in December and
then to a lesser extent in January, February and March (Fig. 19.15d). Considering
CHL as an index of plankton biomass, even in the coastal area where the index
397
Fig. 19.15 SeaWiFS-derived monthly mean CHL [mg m
−3 ], computed as a single average value
for the entire eastern Mediterranean basin (left panels) and the Nile river plume impact area (right
panels): a, b multi-annual trend; c, d seasonal and climatological trend. Time coverage is September
1997–August 2007. Note the different CHL scale used for the Nile-only cases (b, d)
Variations in coastal interactions—due e.g. to changing amounts of coastal runoff,
or to the changing load of water constituents in the runoff—can give rise to episodes
of enhanced ecosystem response. Even small anomalies can be easily detected against
the permanently oligotrophic background of this region, and can be monitored in a
quasi-continuous manner by RS (Barale et al. 2005). Along the southern shoreline,
the Nile River plume has by far the largest impact on the coastal ecosystem, providing a constant source of suspended or dissolved materials (including nutrients) of
continental origin. Such impact was much reduced after the completion of the Aswan
High Dam, in 1964, only to increase again in recent years, due to the high nutrient
load carried by continental runoff in the agricultural area of the delta (Nixon 2004).
The multi-annual trends of the SeaWiFS-derived (monthly) mean chlorophyll-like
pigments, computed as an average value for the entire eastern Mediterranean basin
(30–37
◦ N, 25–37
◦ E, i.e. the whole marine area shown in Fig. 19.2) and for the Nile
River plume impact area (30.5–32.5
◦ N, 29–34
◦ E, i.e. the marine area in the red box
of Fig. 19.2) are shown in Fig. 19.15. At the basin level, maxima are systematically
reached in winter (Fig. 19.15a). However, subtle, but significant, differences appear
for the Nile river plume impact area (Fig. 19.15b). When the 10 seasonal cycles, from
September to August, are plotted together with the climatological mean, the maxima
reached at the basin scale spread evenly from December to March (Fig. 19.15c). But
the Nile river outflow seems to foster an earlier peak, appearing first in December and
then to a lesser extent in January, February and March (Fig. 19.15d). Considering
CHL as an index of plankton biomass, even in the coastal area where the index